When preparing changes to version 2024.1 of the IoT MES system, the main goal was to balance the introduction of new functionalities developing the product, improvements and changes based on customer feedback as well as the implementation of further elements allowing for increasing the level of system configurability through UI. The main changes resulting from the above assumptions are described below. The chapter is divided into 2 parts: Supervisor and Operator Panel.
Supervisor application
During work on version 2024.1, the main emphasis was placed on implementing tools that allow for system configuration. Examples include extending the workstation configuration with flags regarding machine properties, adding configurators for downtime types and micro-downtimes. In addition, the Supervisor application has been extended with additional elements that allow for increasing production control by office managers – through the ability to remotely disconnect operators from operations or edit QC results. In version 2024.1, the process of updating the application with additional views adapted to the phone’s resolution has begun. In production conditions, it is difficult to have constant access to a laptop, so the ability to use the application from a smartphone is a great convenience.
Changes to the quality control results list
Result filtering
In order to facilitate and streamline searching for specific results of performed quality control activities, the 2024.1 version provides a filtering functionality for characteristics. It is possible to select:
- work station – the place where a given active quality control activity was performed
- operation – the specific operation during which the quality control was performed
- creation date – the time range in which the characteristic was generated in the system
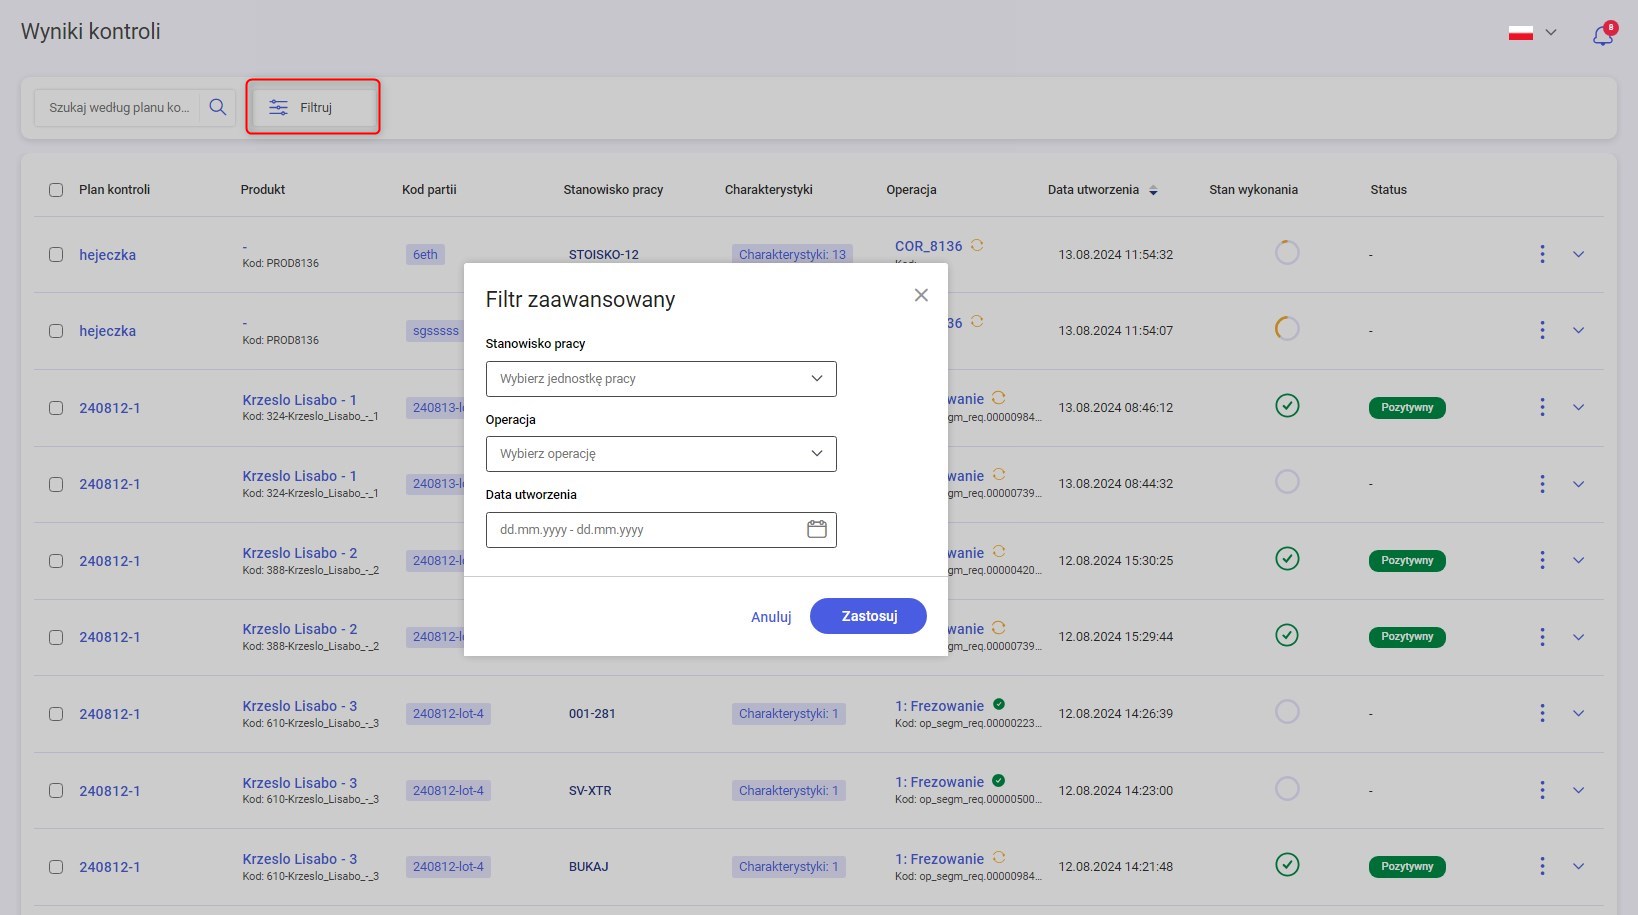
All filters work together, so if the user selects a work station, operations and date – the result set will contain exactly the information matching the logical product of all criteria. The fields for filtering the work station and operations allow for the selection of multiple elements (e.g. 3 work stations). These fields are also equipped with a search option, which significantly speeds up the work.
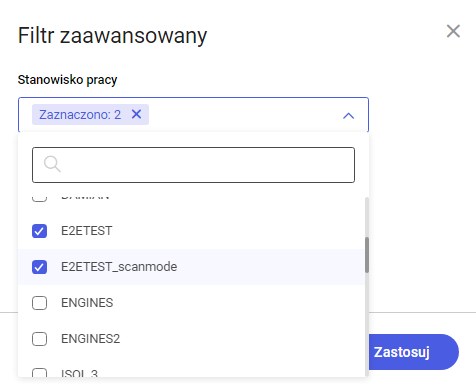
After clicking the Apply button, a list of results matching the selected criteria is displayed. The number on a red background on the Filter button indicates the number of selected criteria (in this case, it is 1, because only the workstation filter was selected). The criteria can be reset using the Reset Filters button.
Editing results
Another change in the list of quality control results is the possibility of editing the result from the Supervisor application. This change is very important from the point of view of implementations in which quality is controlled outside the production hall and workstation. To edit quality control results, the following conditions must be met:
- The user has an MES account created in the system (this can be changed from the Users tab) and a production resource assigned (like any operator)
- The operation has not been completed – this is indicated by the icon in the Operation column – the icon should show a yellow page refresh sign. In the case of a green checkmark – the operation has been completed, it is not possible to update the result
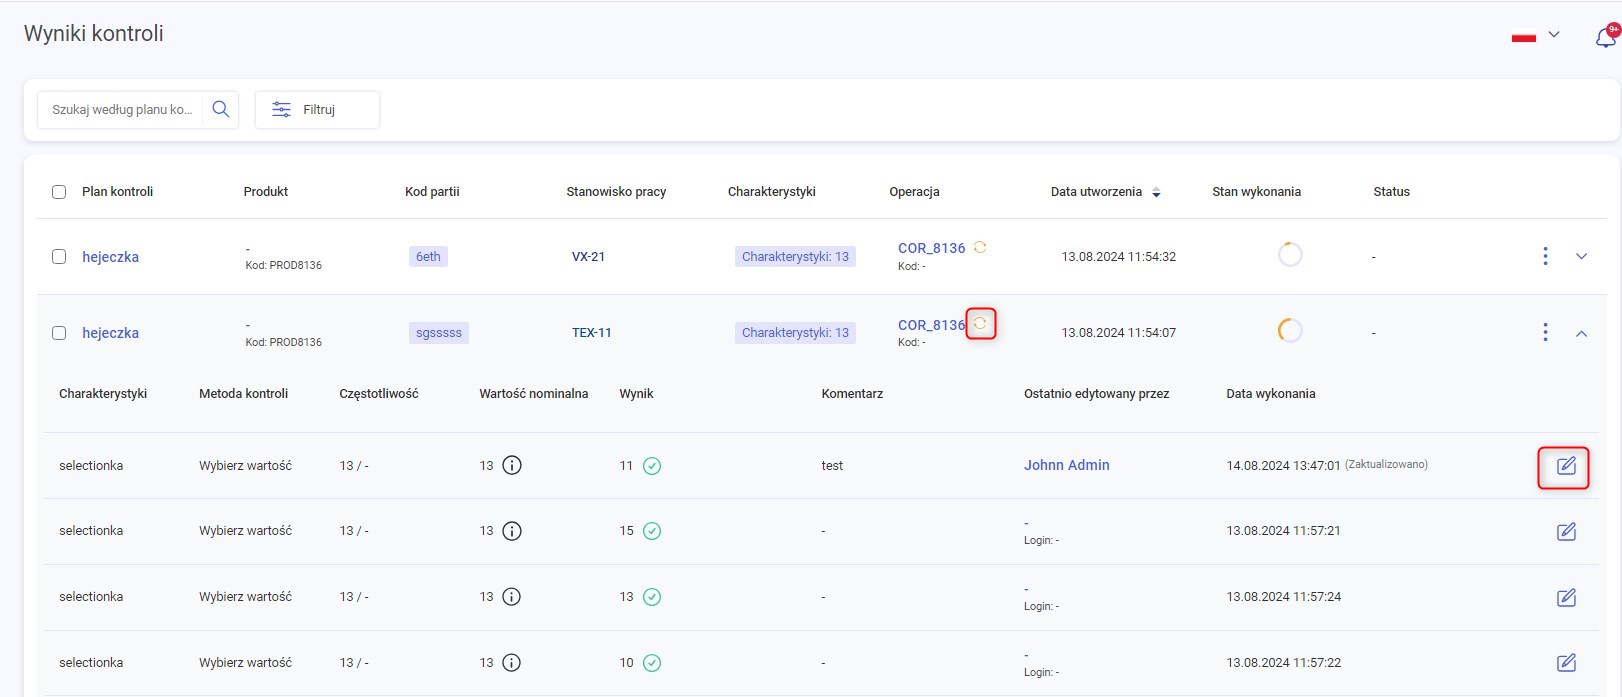
To edit the result, click on the row of the characteristic and press the pencil icon. The user can not only edit existing results, but also fill in generated characteristics that were not performed on the operator panel. Depending on the type of control activity, the user should:
- select the option: OK/NOK from the drop-down list – binary information whether the characteristic is correct or not
- enter the desired value from the keyboard – in the case of the characteristic type: Measurement
- select from the list of available values - for the Select value type
The user can also enter/edit a comment. After making changes, they are entered into the system by pressing the green button on the right. Then the columns Last edited by and Date of execution are updated according to the actual state.

Product Details extension with quality control results
The Product Details view has been extended with a tile informing about the quality control activities performed. This is a summary of the characteristics performed – the subsequent columns provide information about:
- the number of generated characteristics – Characteristics column
- information whether all the necessary quality control measurements have been performed – Execution Status column
- information about the quality control result – Positive if all the results are correct and Negative otherwise – Result column
You can go to the detailed quality control results by clicking the Go to quality control results button

UNS flags configuration
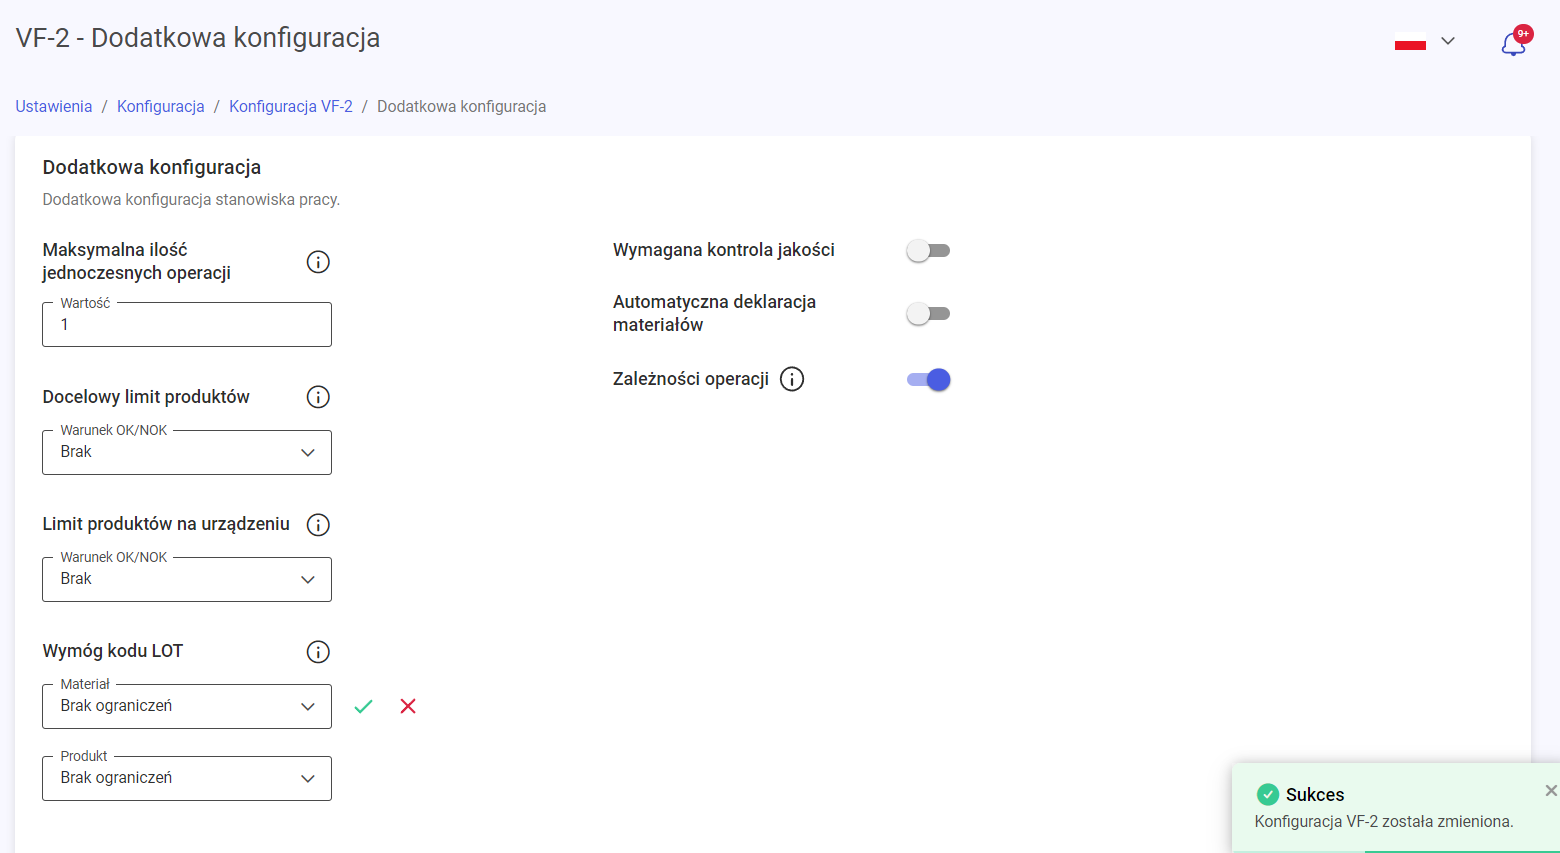
In the IoT MES system, there are configurations strictly related to the properties of a given workstation resulting from the Unified Namespace model. Since version 2024.1, it is possible to set these variables via the UI of the Supervisor application. These configurations are an extension of the functionality from previous versions (where it was possible to set, among other things, the global configuration of workstations). To separate the configurations, a separate tab has been added, which you can go to by selecting Settings -> Configuration, and after selecting the workstation of interest and clicking the Set configuration button – the Additional workstation configuration tile.

Parameters that can be changed:
- Maximum number of simultaneous operations – the number of operations that can be open at the same time (if the limit is reached and an attempt is made to start the operation/changeover, a toast with error information is displayed on the operator panel UI)
- Product limit – manual addition of pieces – a configuration that determines how to determine the production limit – whether the system should allow the operator to add more pieces than assumed, and if not, whether incorrect pieces should also be included in the limit. Possible settings: None, Only OK, OK+NOK
- Product limit – machine production – a configuration similar to the above, but applies to pieces counted based on signals from machines
- LOT code requirement – a configuration that decides whether the operator can enter a batch code that does not exist in the system. Products and materials can be configured separately
- Quality control required – a flag needed in cases where the system forces the operator to perform and enter quality control into the system, and only then determine the correctness of the piece. The flag accepts binary values
- Automatic declaration of consumed materials – materials can be settled automatically based on declared products (the system calculates how many materials should be used per product unit based on the BOM and updates the values) or declared manually by the operator. The flag accepts binary values.
- Initial declaration of materials – the ability to download a list of pre-declared values from the ERP system, which are a ready base for the operator
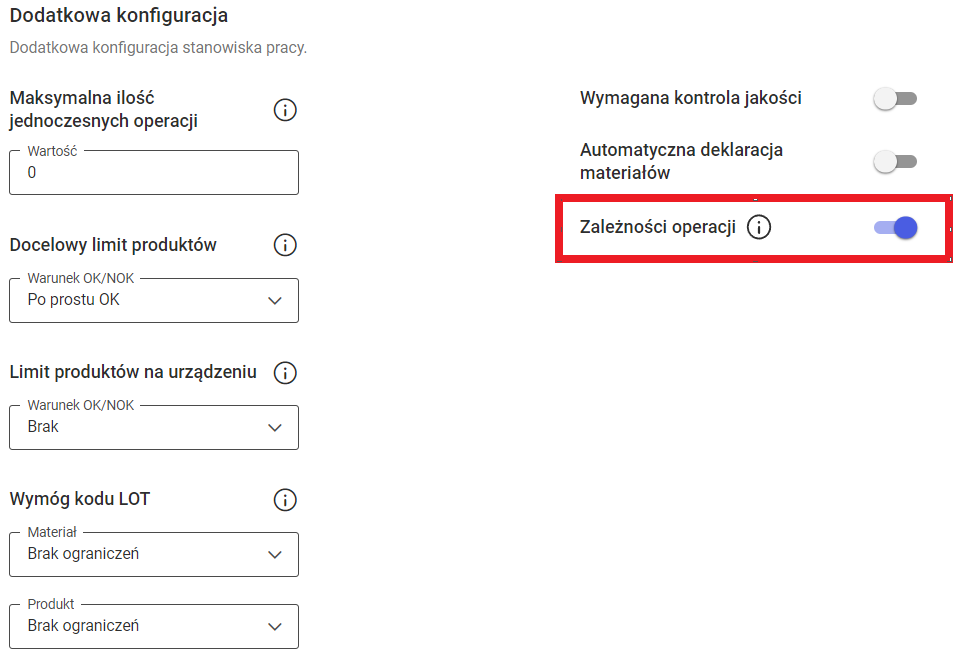
- Operation dependencies – the flag is connected to the functionality implemented in version 2024.1 – it specifies whether the system should take into account the dependencies between operations, e.g. operation A must start before operation B (if this information comes from the ERP system).
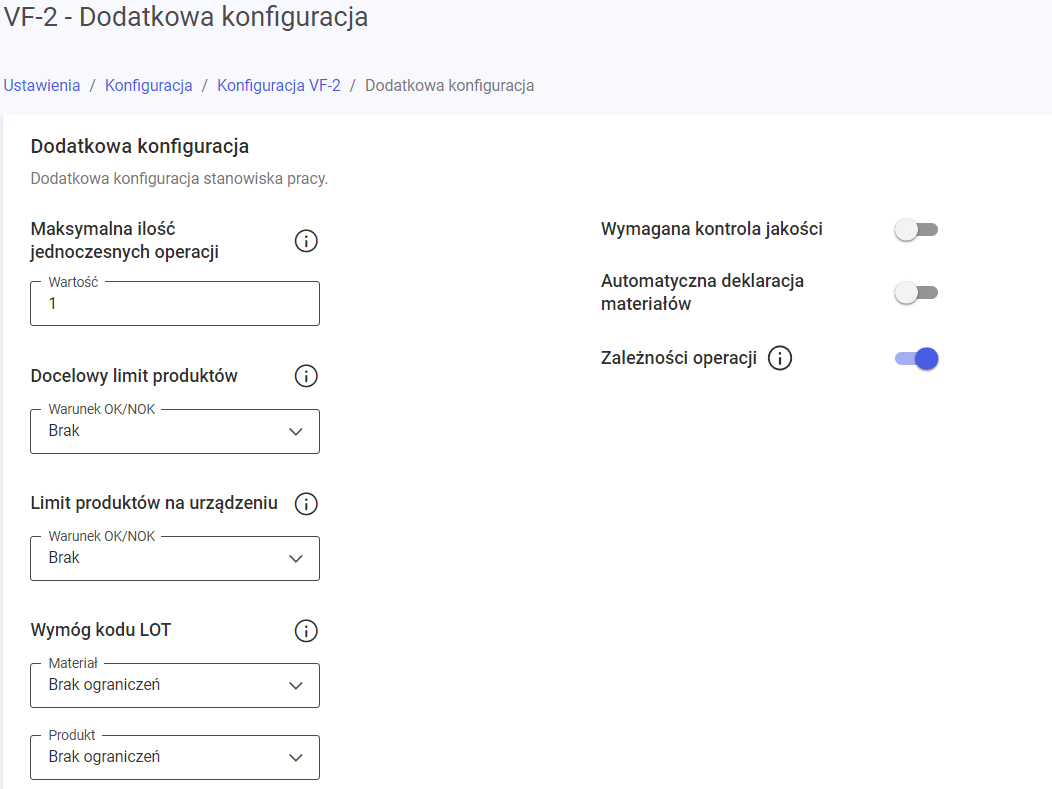
The configuration flags on the right side change their value automatically after changing the switch position, while the items on the left side – you should click on the green check icon next to the given property (the green icon for approval and the red icon for cancellation are displayed after changing the value of a given setting).
Micro-stoppage type configurator
In version 2024.1, further configurations have been made available through the Supervisor application UI. One example is the ability to create, delete and edit micro-stoppage types. A micro-stoppage is a short, unplanned downtime recorded in the system quantitatively.

After going to the Settings tab, and then Definitions – the user can select a new tile – Micro-stoppage. All types of micro-stoppage configured in the system will be displayed. The collection model provides for the ability to assign micro-stoppage types to types of workstations – although this can be a 1-to-many type of assignment, not 1:1, which increases the flexibility of the system.
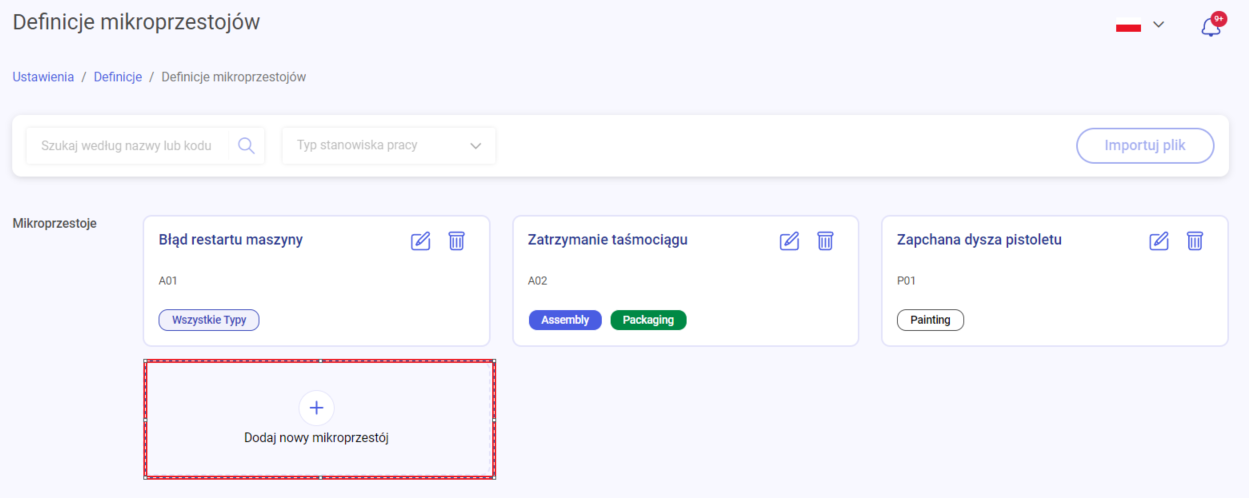
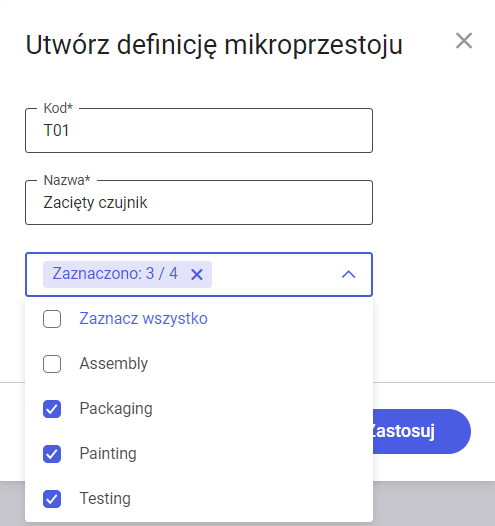
To add a new micro-stoppage type, click on the field marked Add new micro-stoppage. An additional window will be displayed, in which the user should provide:
- code – mandatory field
- name – mandatory field
- types of workstations, where the operator will be able to select a given type of micro-stoppage
To edit, click the pencil icon, and to delete a type – the trash can icon. Both icons are located in the upper right corner of each definition. You can edit all elements visible when creating a type, i.e. code, name and types of workstations.
Displaying the customer name in the order and in the order list
In version 2024.1, the ability to support the display of the target customer name has also been made available, if such information is included in the production order.
Information about the customer name is located in the list of production orders (Production tab)


Downtime type tree configurator
Another element of the system configuration made available through the UI in version 2024.1 is the downtime type tree configurator. The functionality is based on the types of work stations. By default, 4 types of work stations are available in the system: Machine (Assembly), Packaging, Painting, Testing. Each type has a separate downtime type tree, which the user can freely configure. On the operator panel, after clicking the Downtime button, a tree will be displayed, consistent with the type of the given work station on which the user is working. Additionally, downtimes that are configured globally for all work stations (All work station types) are displayed.
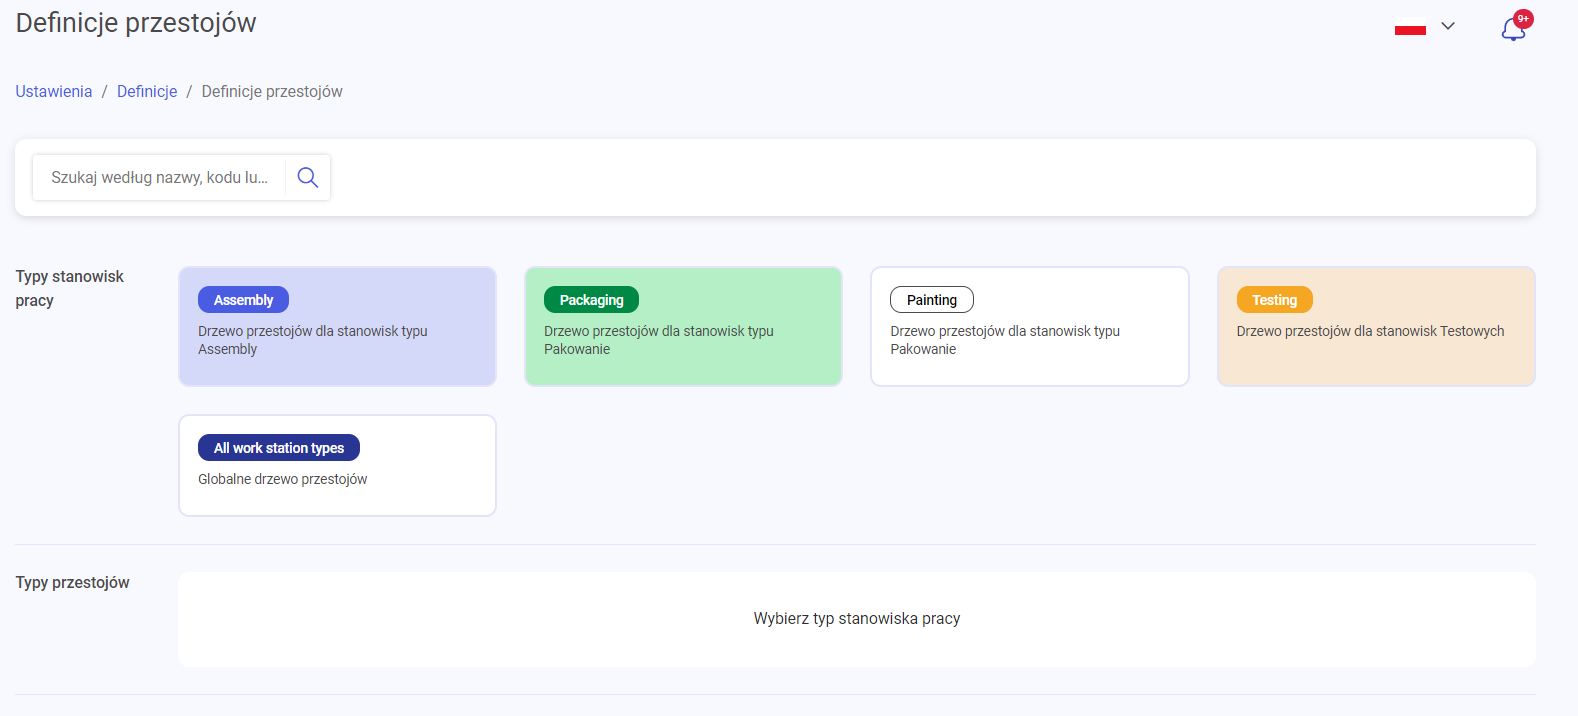
After clicking on a type, 4 tiles are always displayed, allowing the configuration of:
- planned downtimes
- unplanned downtimes
- planned setups
- unplanned setups
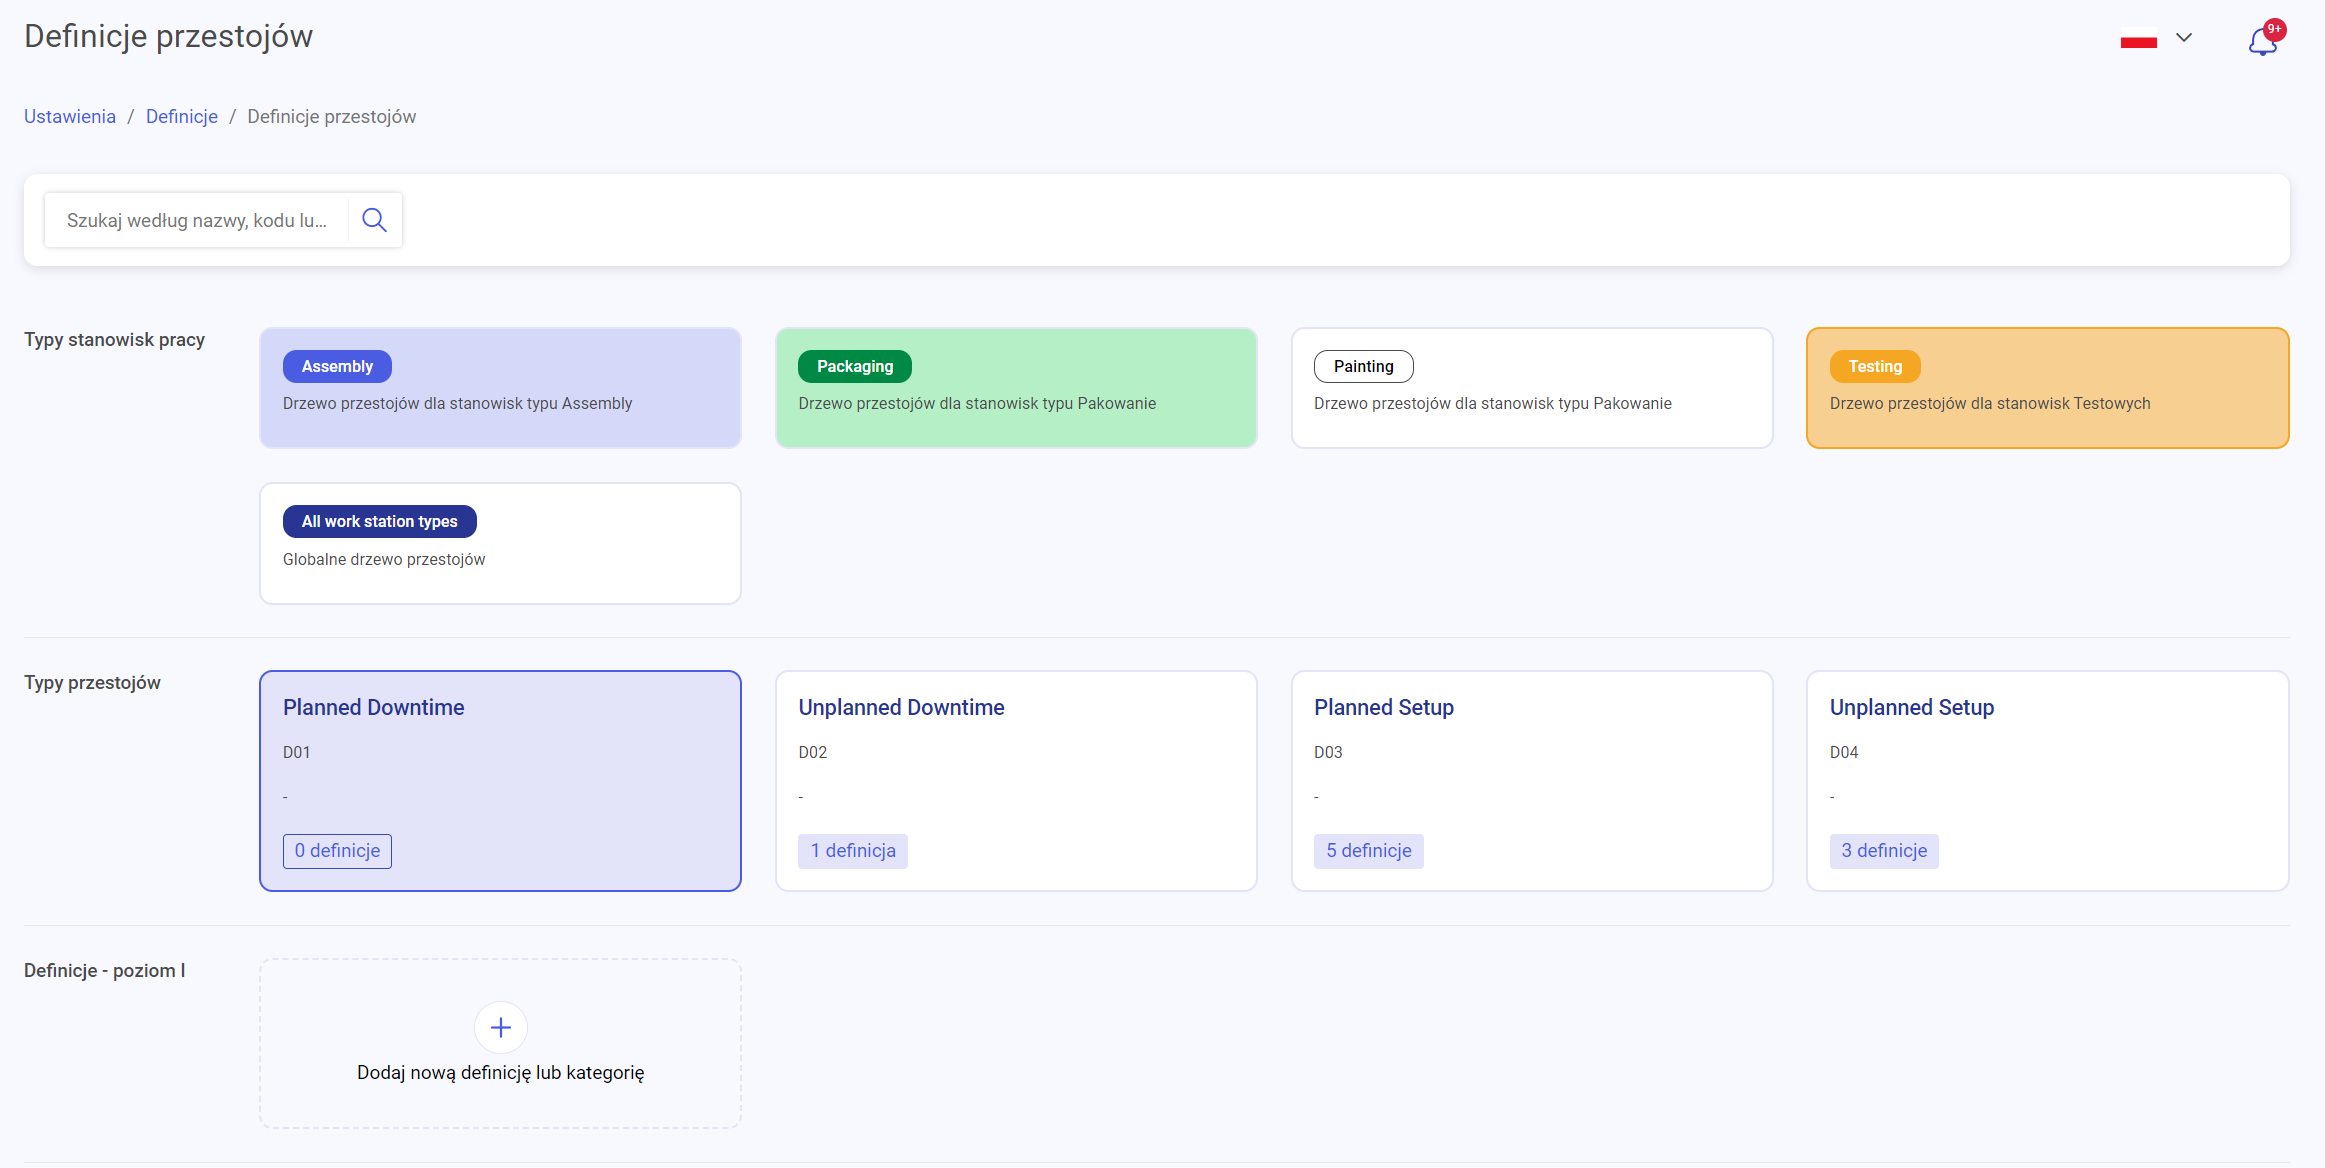
The model allows you to distinguish between downtime categories and definitions. A category is a type of folder that groups definitions in one place, while a definition is a specific object, e.g. Hydraulic system failure. The downtime type tree can have a maximum of 3 levels. To streamline event analysis, the option of automatically enabling unplanned downtime after the time specified for a given planned downtime definition has elapsed has been made available.
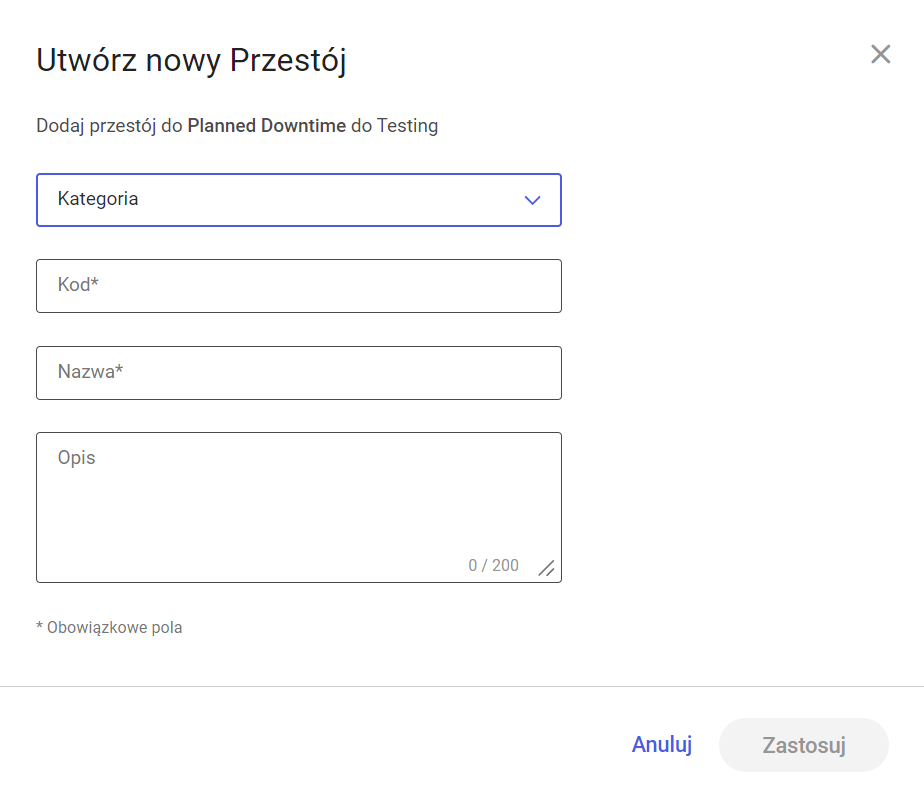
To add a new category, click the Add new definition or category button. Then select the Category type from the drop-down list and fill in the code and name fields. This information will be displayed on the operator panel.
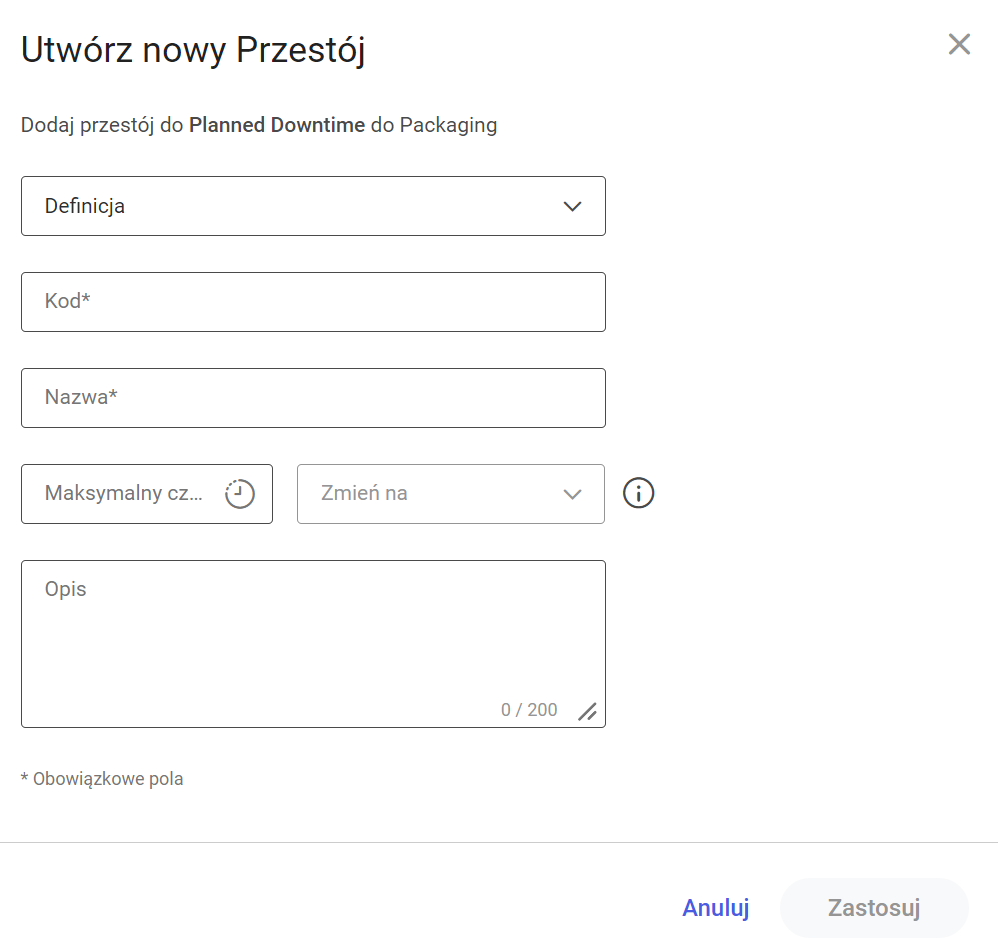
You can create definitions in a similar way, but it contains additional optional fields:
- Maximum duration – the time it takes to repair a given problem
- Replace with – a drop-down list of unplanned downtimes. After selecting a downtime from a given list – after the above-mentioned maximum duration has elapsed – the system will automatically end the planned downtime and start an unplanned one
After creating a category/definition, you can edit and delete an element. The pen and trash can icons on the tile of a given definition/category are used for this purpose. To make work more efficient, if the entire category is no longer needed, clicking the trash can icon will delete all definitions that were parented by the given category.
Detaching operators from operations
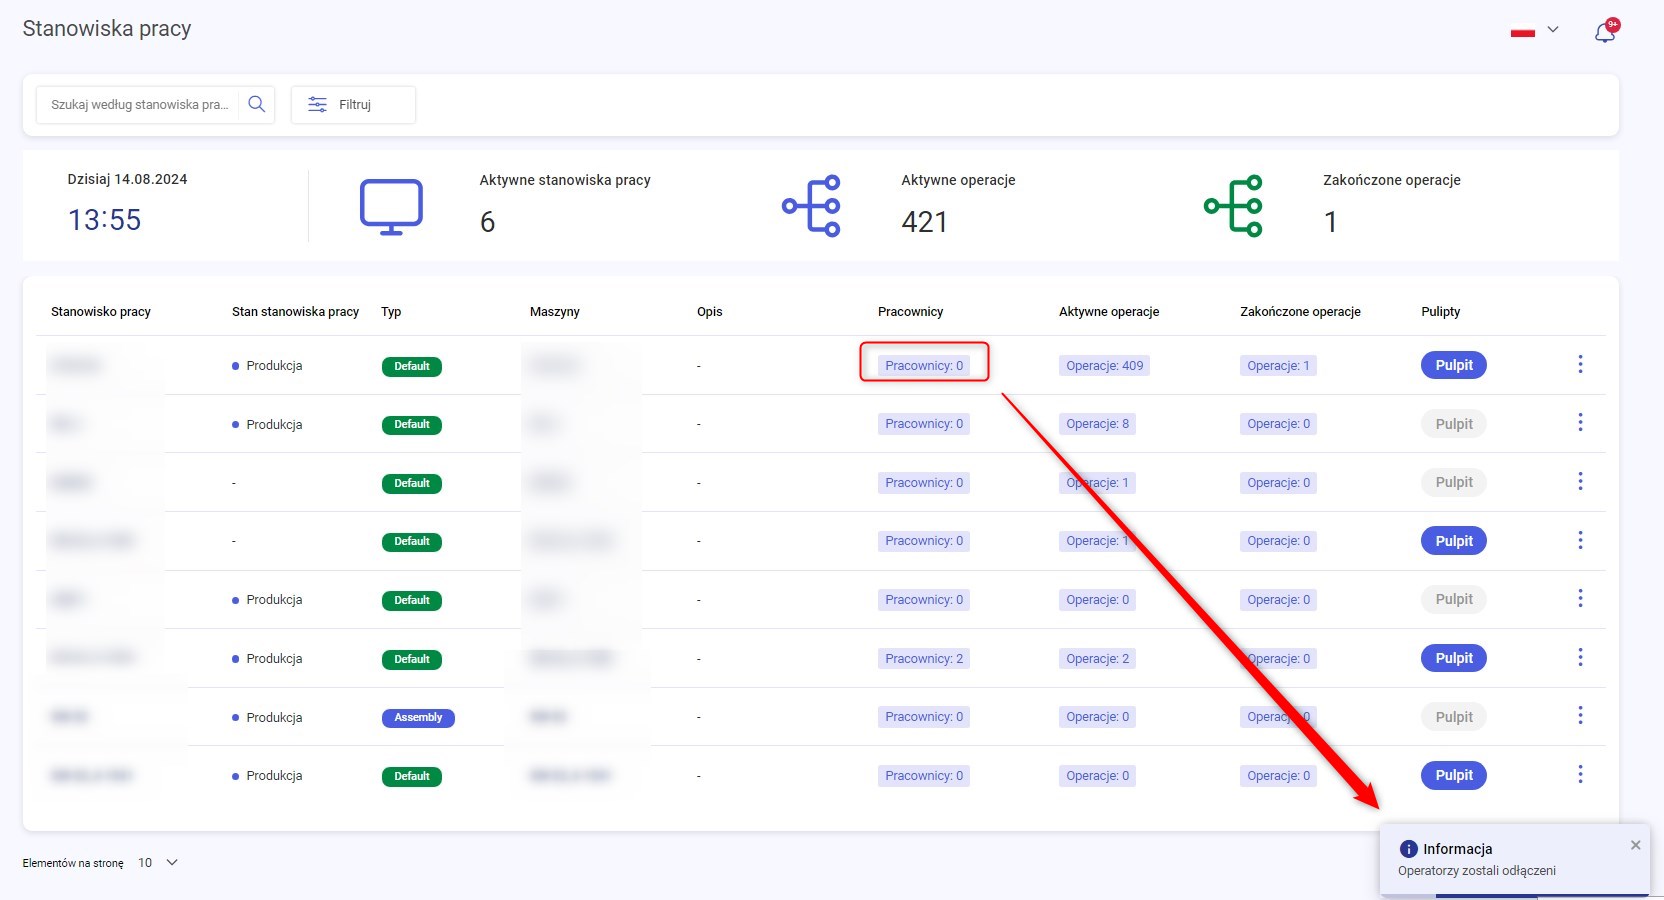
To improve production management on the production floor and reduce the problem of errors in calculating KPI indicators caused by the lack of detaching operators from operations – the ability to detach operators from ongoing operations at a workstation has been introduced. The functionality has been implemented in the Desktop tab – after clicking the ellipsis icon in the row corresponding to the workstation – the Detach operators button appears.
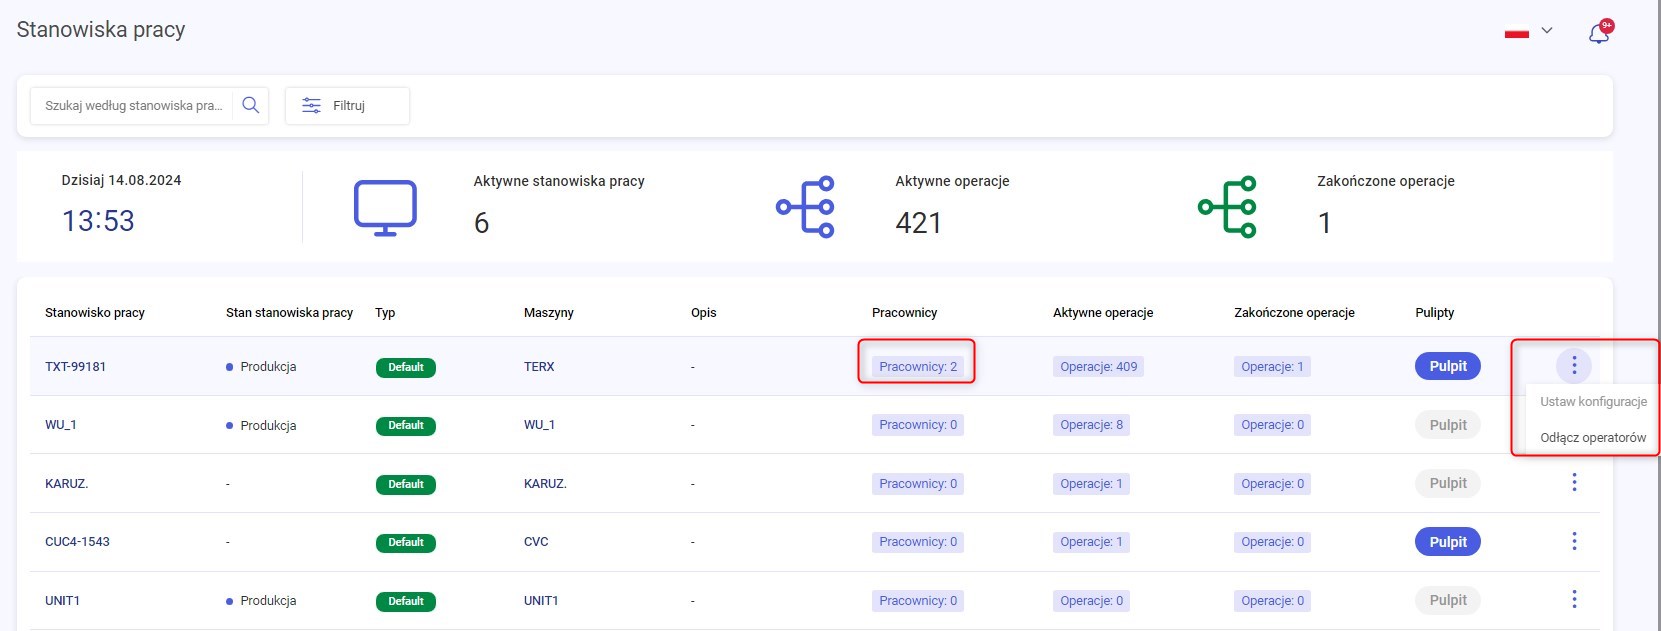
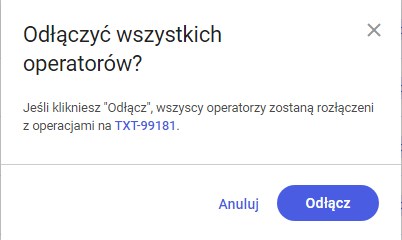
After confirming in the pop-up window with the Detach button, all operators attached to the operation at a given workstation are automatically detached from all operations. At the moment of detachment, the page is refreshed and the current number of employees attached to the operation is displayed in the Employees column.
Responsive application views
One of the main goals of the Supervisor application is to make the work of people managing production from the office as easy as possible. In production conditions, it is difficult to have constant access to a laptop, so the ability to use the application from a smartphone is a great convenience. In version 2024.1, the process of updating the application with additional views adapted to the phone’s resolution has begun. Views have been implemented that allow for convenient use of the following functionalities:
- List of production orders
- List of products and materials
- Product details
-
List of maintenance definitions
Detailed report of machine operating states
Another important functionality provided in version 2024.1 is the machine operating states report. The functionality aims to clearly present what happened at the workstation in a specific time period. The report can be generated by selecting a time range – a maximum of one week. After selecting the range, the system lists all recorded changes in the machine status and generates a time summary of each element.
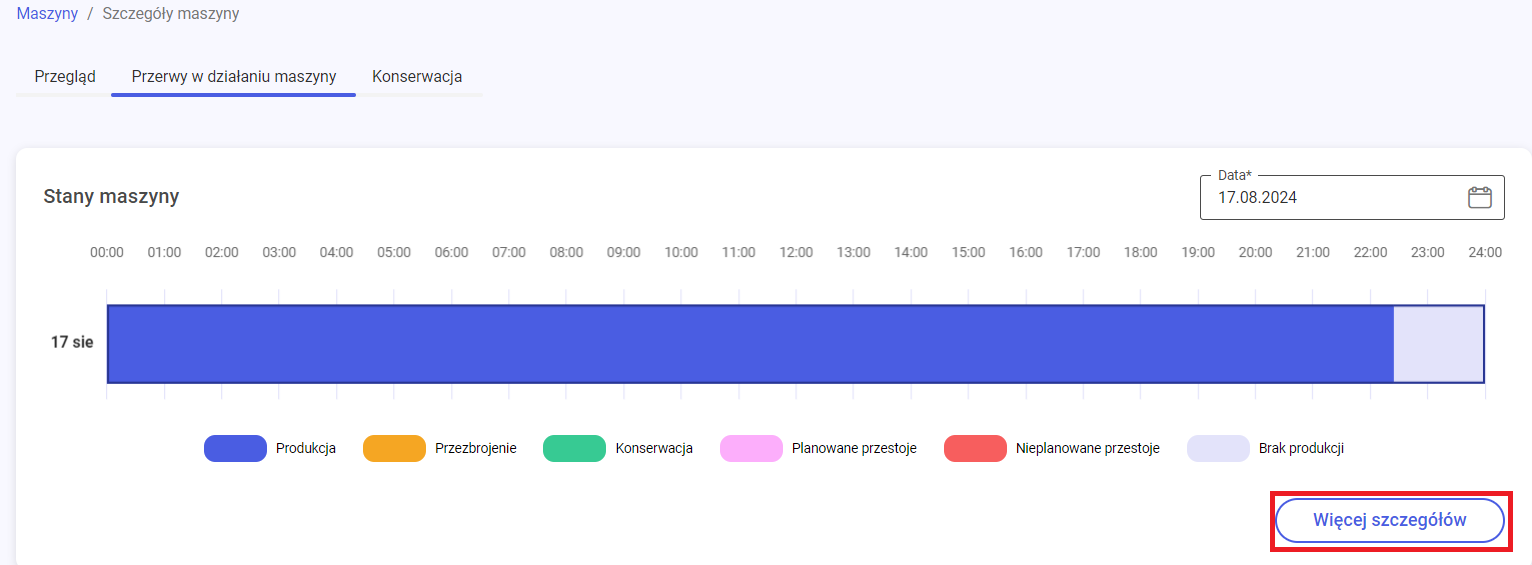
To go to the report, press the More details button in the Machine Details window. A new window will be displayed, in which the upper part is a chart already included in the previous version, while the lower part – a list of all time ranges for the given states. The foreground displays the operating states and the total duration in the given range (Duration column) and the number of occurrences (Quantity column). You can sort by each column by clicking the arrow icon.
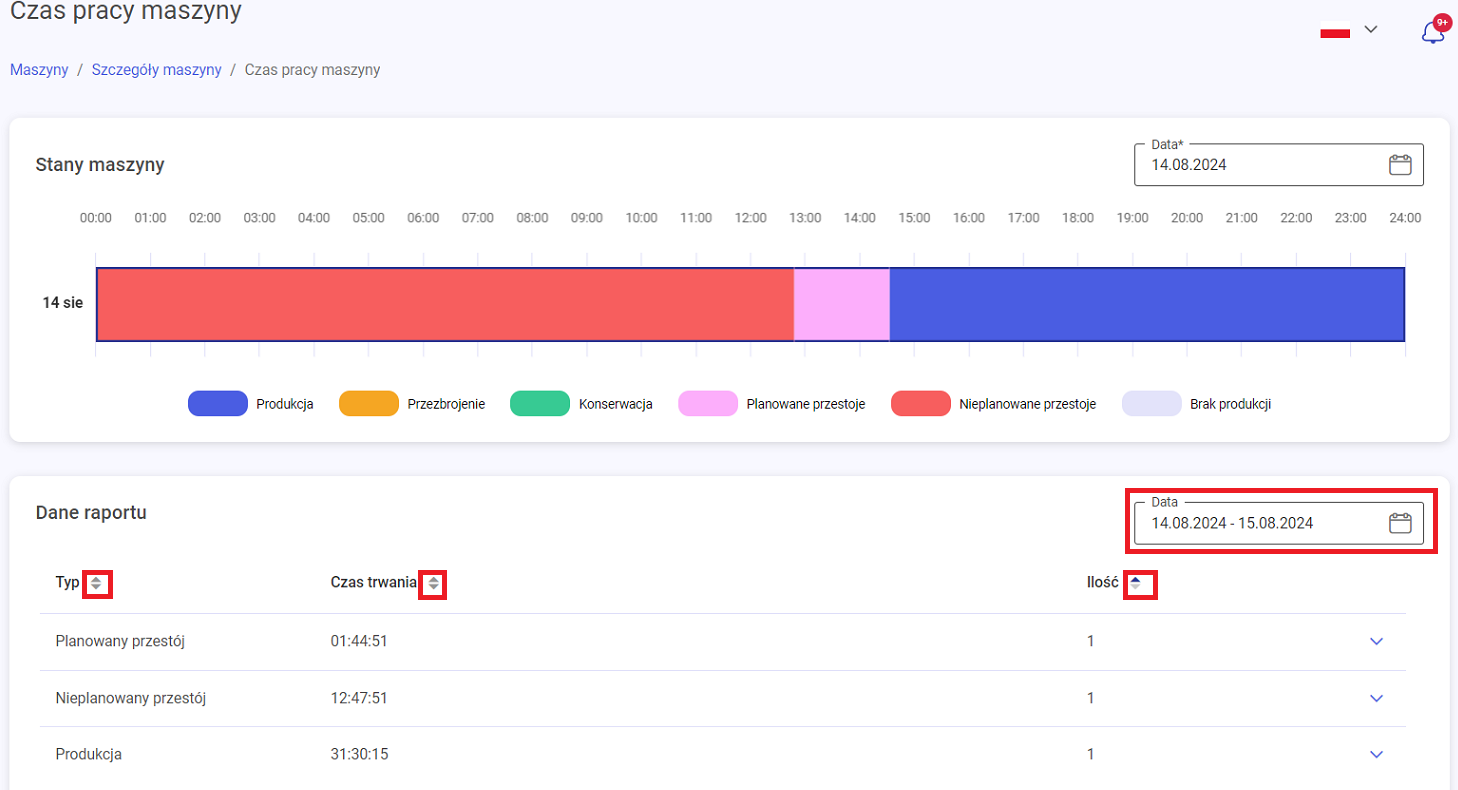
The Operating States chart is built based on current data from the database collected from the production station. The following states are distinguished in the system:
- Production
- Setup
- Maintenance
- Planned downtime
- Unplanned downtime
To obtain detailed information about time ranges, click the arrow icon on the right side of the desired row. A list of individual events is displayed, containing information:
- Duration
- Start – if the event started before the beginning of the filtered range – the information: started earlier will appear, and the date will be the beginning of the range
- End – if the event ended after the end date of the filtered range – the information: ended later will appear, and the date will be the end of the range
Notification module (bell, notification center)
Another important functionality made available in version 2024.1 is the notification module. The module is intended to inform users about important events registered in the IoT MES system. Version 2024.1 includes notifications from downtimes – when a downtime (start or end) is reported on the production floor at a workstation, the Supervisor application user (if authorized) will receive a notification about it. The notification module will be developed with further elements in future versions of the application.

To check the notification, click the bell icon – notifications are displayed sorted from newest to oldest. Notifications are not automatically marked as read – this must be done manually. In the window, you can mark both a single notification as read by clicking on the field of a given notification – as well as all notifications as read by clicking the Mark all as read button.
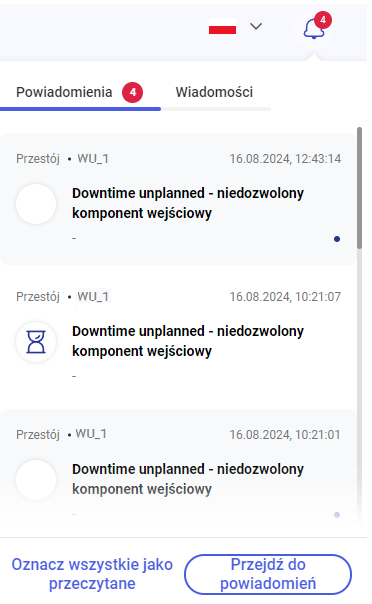
To go to the dedicated tab, select the Go to Notifications button. The Notification Center is displayed – a historical list of notifications with details and the possibility of filtering. Marking as read is identical to the intermediate window – you can click on individual notifications or click Mark all as read.
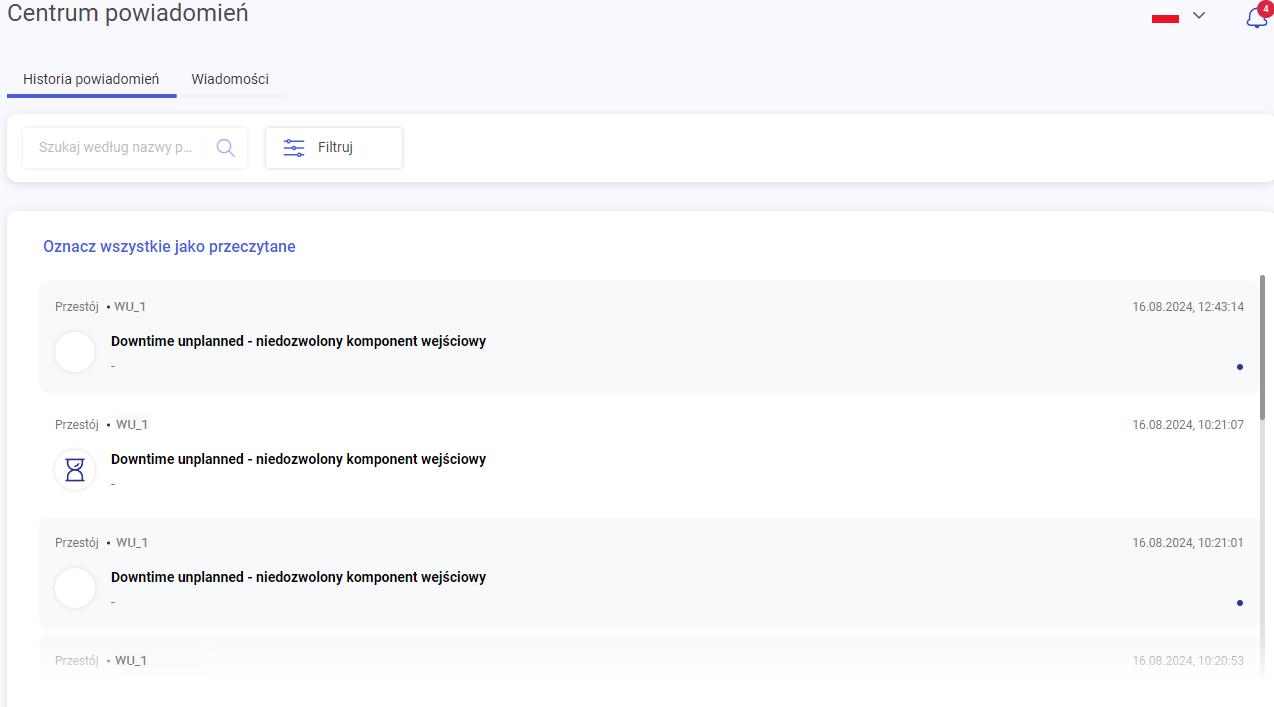
A single line contains:
- Information on what type of downtime it was (Downtime planned / unplanned)
- The name of the downtime
- Description of the downtime type entered in its definition
To filter notifications, click the Filter button, then select the time range in the date field and confirm with the Apply button.
Operator Panel
On the Operator Panel side, the main changes are related to functionalities resulting from cooperation with ERP systems (e.g. handling of operation dependencies), development of new possibilities (e.g. deleting declarations, operator report), as well as corrections and improvements enabling convenient work of system Users.
Daily report
In version 2024.1, the functionality of a report covering production events at a given workstation has been made available. The report aims, among other things, to make it easier for the operator to start work on a shift – it allows for a quick check of what happened on the previous shift and whether any significant production events occurred. The report also allows the production manager to check how work was carried out in a given time range at the workstation.
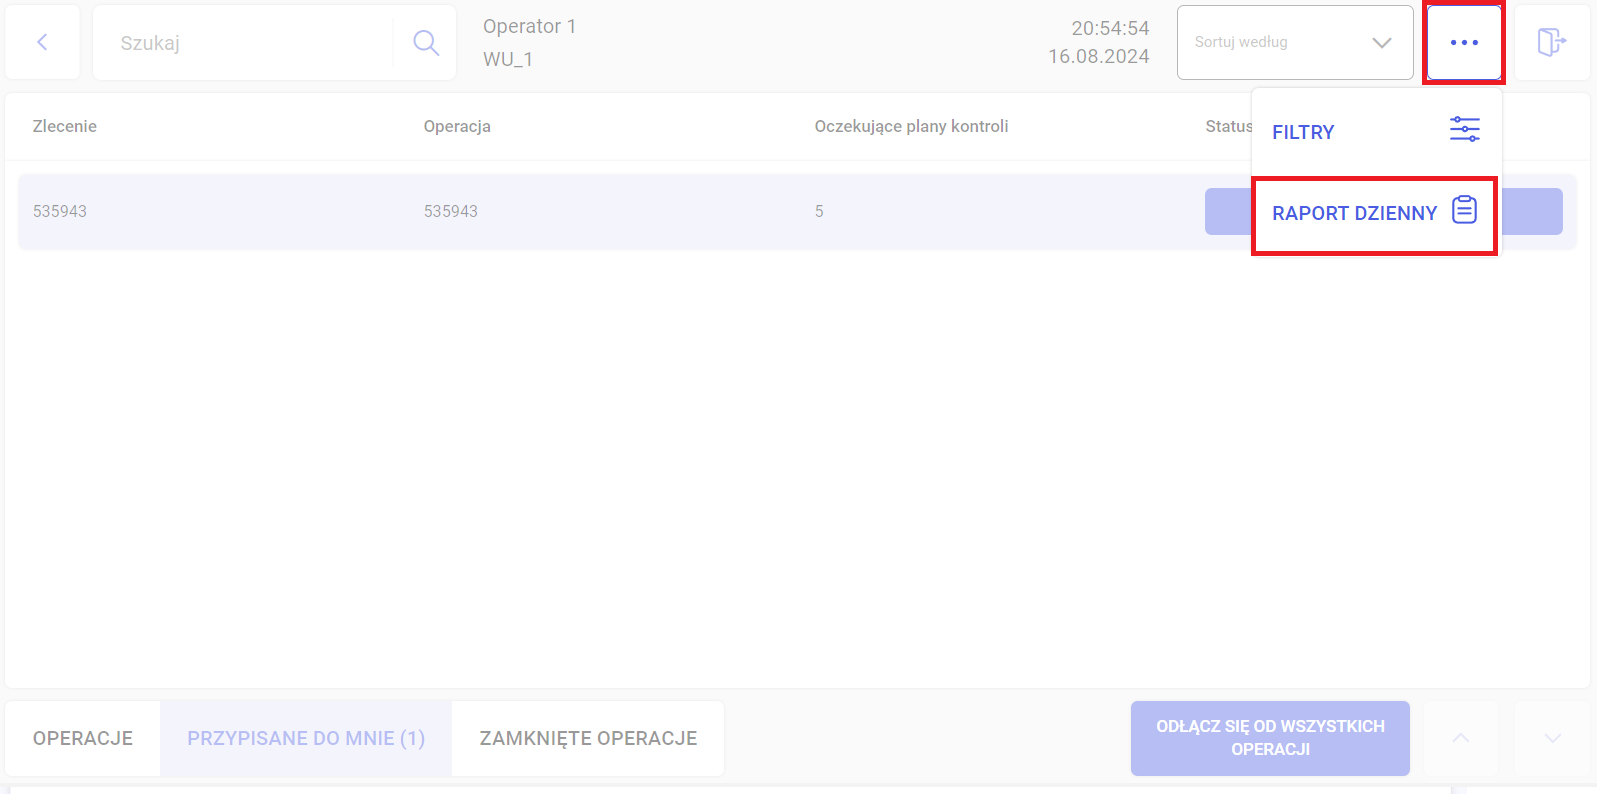
To go to the report, select the workstation, then click on the ellipsis icon in the upper right corner and select: DAILY REPORT.
The report consists of a list of production events matching a given workstation. The following types of events can be checked:
- Joining an operation
- Detaching from an operation
- Planned downtime (information on start and end)
- Unplanned downtime (information on start and end)
- Planned setup (information on start and end)
- Unplanned setup (information on start and end)
- Start and end of an operation
- Logging in to the terminal
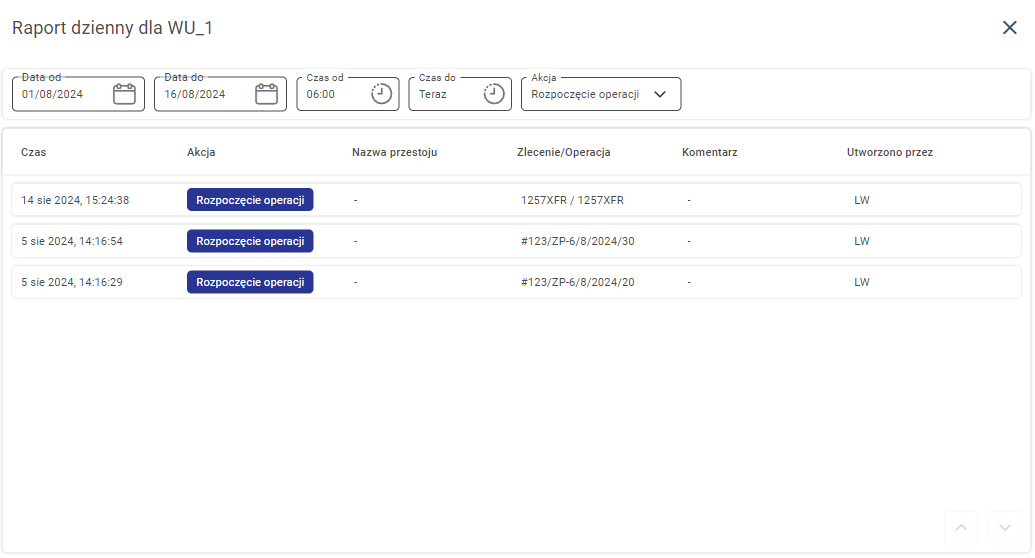
The list of the above events to be filtered is available after pressing the button: Action. This list is generated dynamically, only those types of events that occurred in the time range set by the user are displayed. To set the range, use the Date from, Date to and Time from, Time to buttons – which allows for very precise setting of the desired deadlines.
Detaching operators
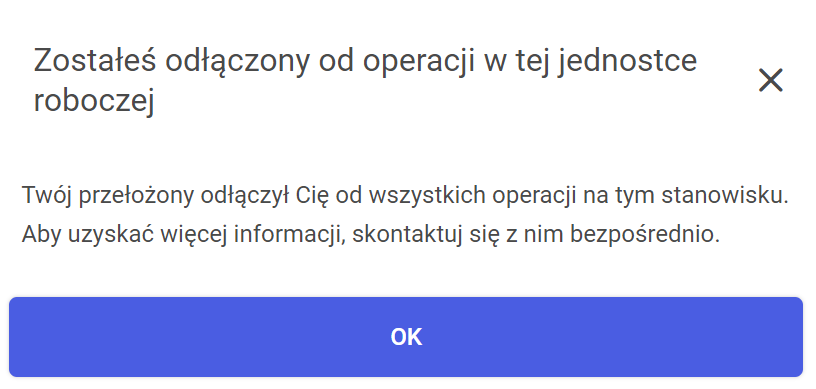
The main part of the functionality has been described on the Supervisor application side. The functionality is mainly used when the manager is sure that no one is working at a given position and disconnects operators in order to avoid distortions when calculating KPI indicators. However, if the operator is working on an operation at a given position, and the above-described disconnection from the Supervisor level occurs – information about the event is displayed on the screen. The operator can connect to the operation again.
Change of BOM view
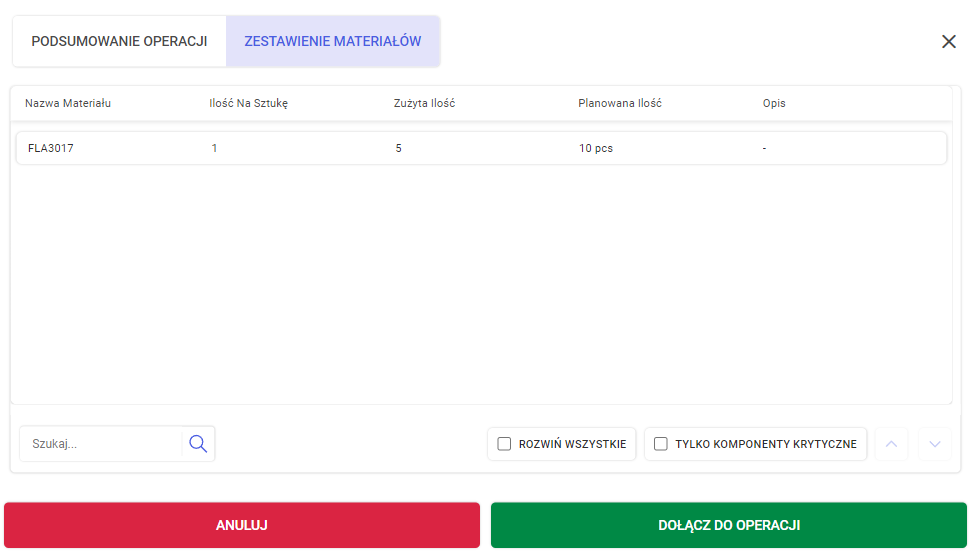
The more complex the operation, the more consumed materials must be used to produce a product unit – which can lead to errors in the work of the operator registering the consumed items. For this reason, the list of materials (BOM) has been redesigned to facilitate the operator’s work as much as possible. A column has been added informing how much material is consumed to produce one product unit. Additionally, a description of the material definition has been introduced – which increases readability in the case of complex codes.
To check the list of materials – after selecting the workstation, select the desired operation from the list and then click BATCH OF MATERIALS.
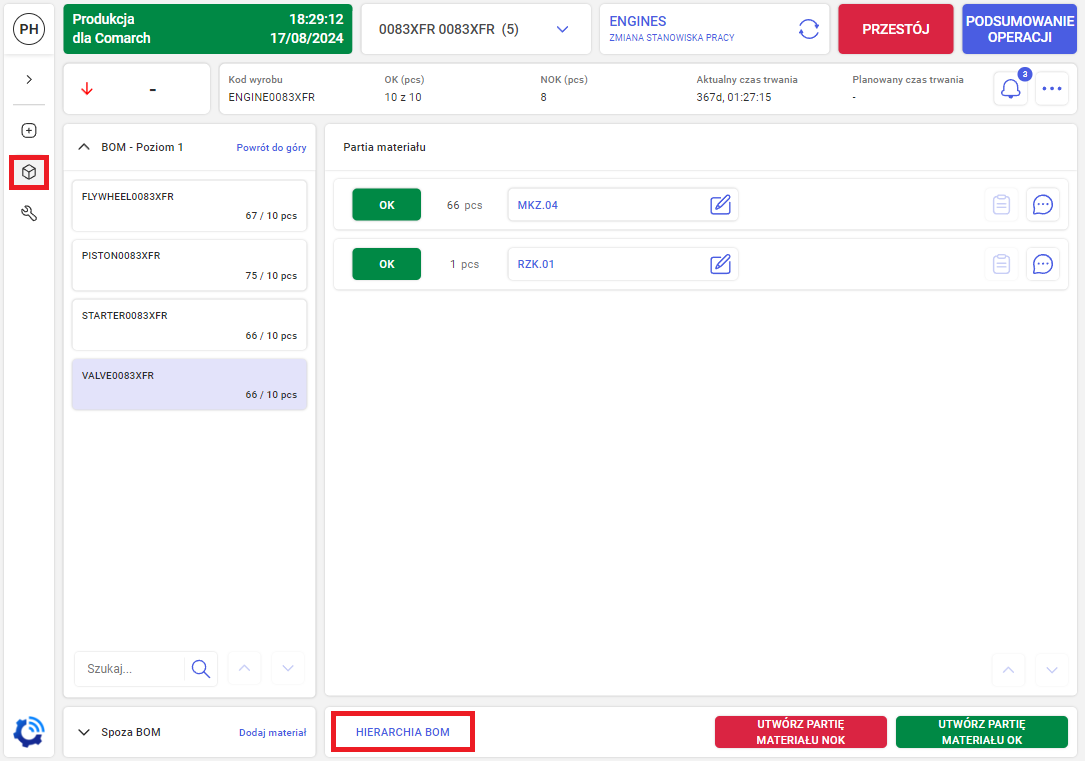
The BOM list view has also been updated inside the operation. After opening a given operation, selecting the Material tab on the left and clicking BOM HIERARCHY, a list containing identical columns as described above is displayed.
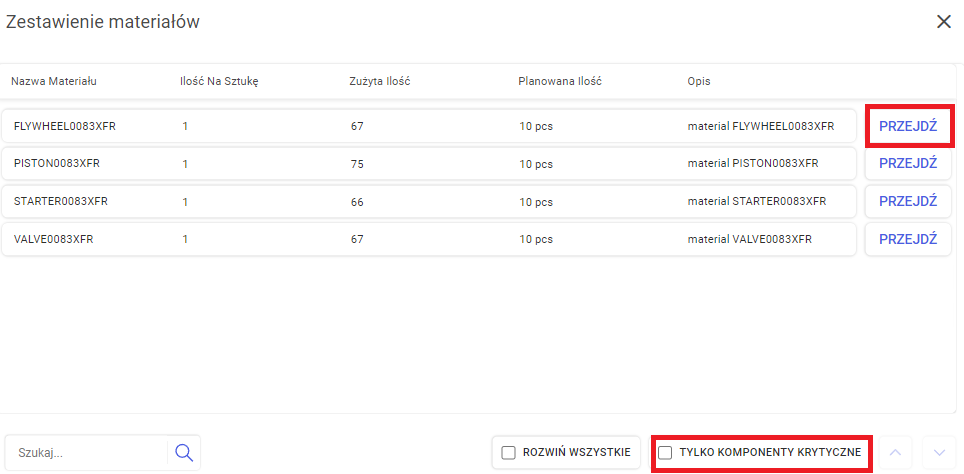
Additionally, each row contains a dedicated GO button, which leads to the list of declared consumed materials of a given definition. The list can be filtered for critical components (CRITICAL COMPONENTS ONLY checkbox in the lower right corner) and searched by entering the material name.
Filtering the list of operations
In version 2024.1, the functionality of filtering the list of production operations has also been remodeled and expanded. To limit operations to the desired scope, click on the ellipsis icon in the upper right corner of the panel, and then select the first button from the list – FILTERS.

The advanced filters field will be displayed on the right side of the screen. It includes 3 elements:
- Selected columns – the ability to set which information is to be displayed on the operator panel and which remains hidden. Due to the fact that this is a new functionality, it will be described below
- Status – the ability to choose whether to display planned, ongoing or interrupted operations
- Operations from – the ability to display operations that are planned for other workstations on the list – those that are marked in the Supervisor application as replacements for production stations (Unblocking/blocking the button is possible through configuration in the Supervisor UI – System Configuration chapter)
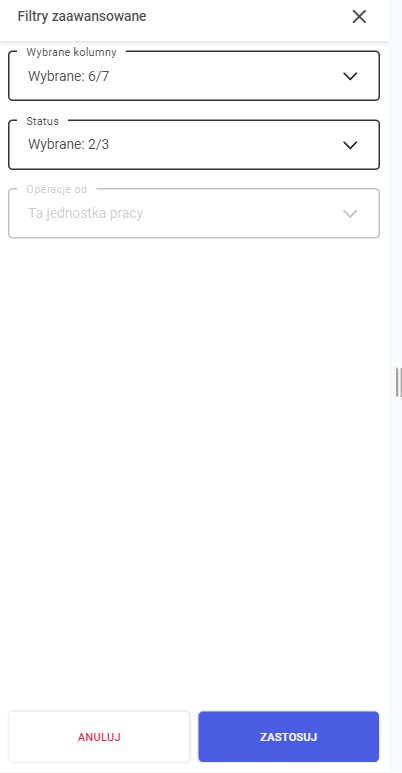
The ability to filter columns is an important convenience that allows you to adjust the appearance of the list of operations to the needs of a given workstation. On the panel, 4 types of columns have been classified as fixed, unchangeable (they cannot be unchecked and thus removed from the list). These are: Order, Operation, Planned start and Status. The remaining columns can be freely shown and hidden:
- Customer name – depending on the ERP system, this information may come with the production order. In some production processes, this is important information for the operator
- Operation description
- Product code – product designation
- Produced quantity – the number of pieces that have been planned for production
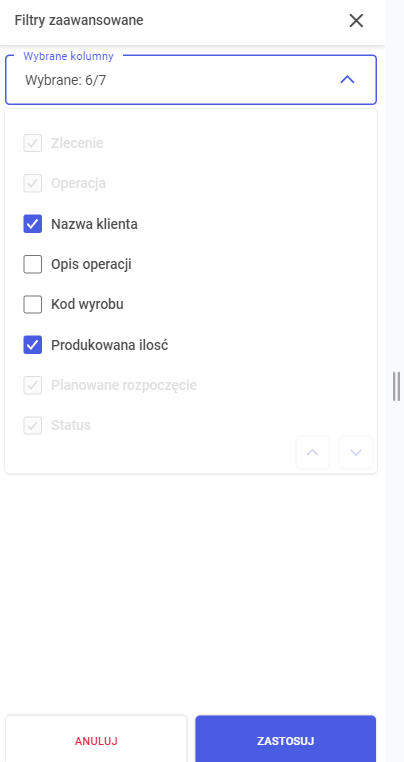
After selecting the option and clicking the APPLY button, the appearance of the list will be adjusted according to the filters.
Possibility of setting no automatic logout from the system
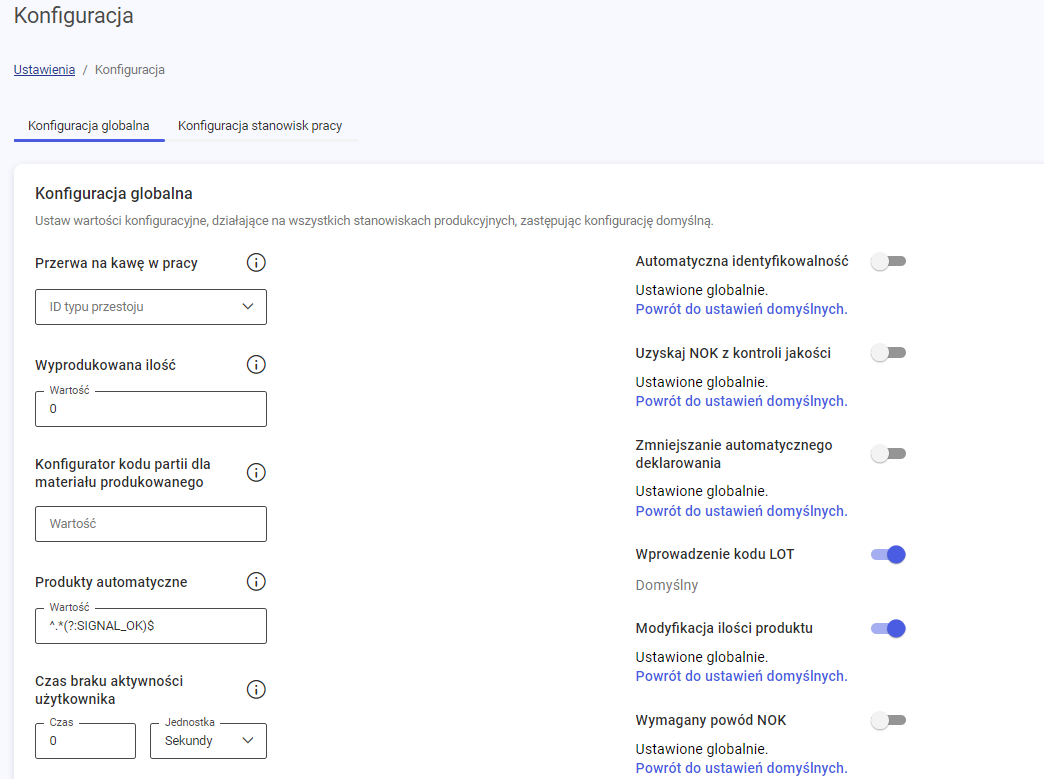
Since version 2024.1, it is possible to disable the option of automatic operator logout after a specified time. To set this option, go to the global configuration of production stations – select Settings from the menu, then Configuration and click the Global configuration option. In the User inactivity time field, set the value to 0 and save by clicking the Change button in the lower right corner. For such a configuration, the operator will not be automatically logged out of the system after logging into the terminal.
Displaying the customer name in the order and on the order list
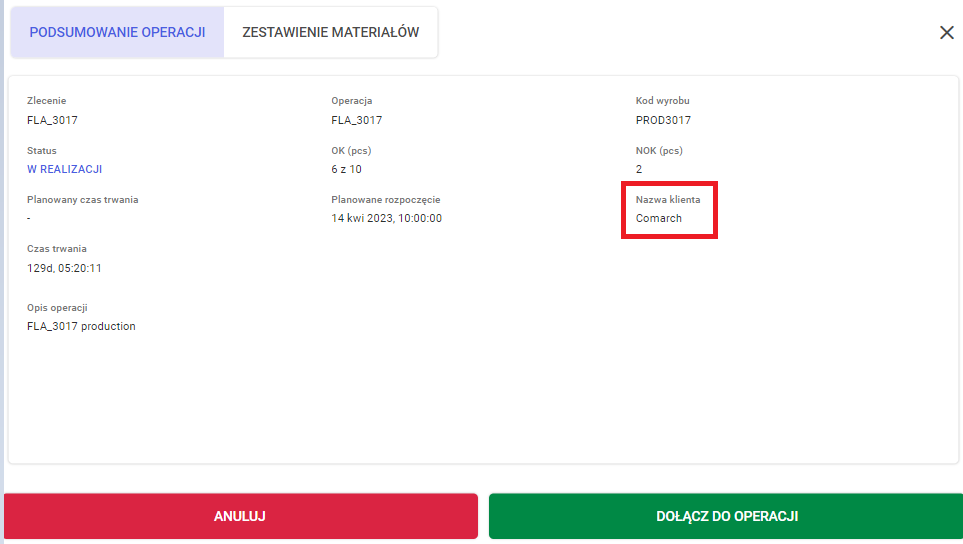
In version 2024.1, the ability to support the display of the target customer name has also been made available, if such information is included in the production order. To check for which customer a given product is manufactured, go to the list of operations at a given production station – the information is in the Customer name column. After selecting a specific operation, the information is also in the OPERATION SUMMARY tab.

Validation of multiple use of the same measurement from a measuring device
The IoT MES application provides for the possibility of configuring control plans with automatic downloading of measurement results from physical devices. In version 2024.1, validation has been implemented to check whether a given measurement has been used in any quality control activity before. This is intended, among other things, to limit the possibility of an operator error, who downloads the control result without first performing a physical measurement on the device.
In the case of an attempt to download a value that has already been used earlier, a window is displayed informing why the value could not be downloaded. Additionally, the operator can enter the measurement result manually. This is necessary in the event of loss of communication between the device and the IoT MES system.
Deleting declarations
One of the key changes in the system included in version 2024.1 is the addition of the possibility of deleting declared products. In the event of an operator error and declarations of incorrect additional items, the user can delete the declaration by clicking on the ellipsis icon in the desired line and clicking the DELETE button.
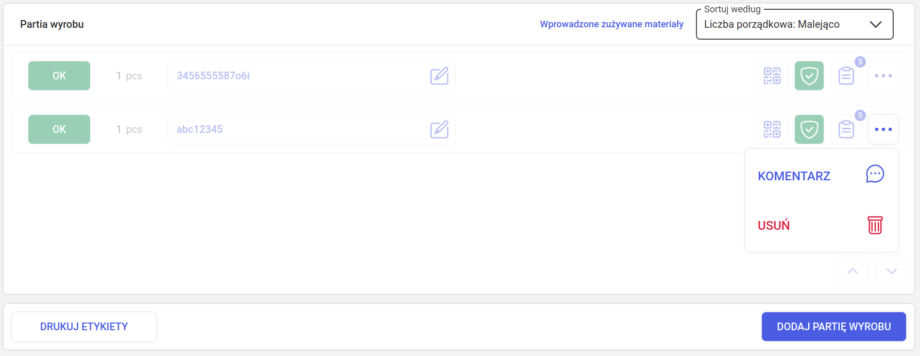
An additional window will be displayed, in which the operator must confirm their choice by clicking the YES, DELETE DECLARATION button. After successful deletion, information will be displayed in the lower right corner of the screen. It is not possible to delete product pre-declarations.

Dependencies between operations
Another major change is the support for dependencies between operations in a production order. IoT MES in version 2024.1 enables support for the following types of dependencies.
- The operator cannot start operation B if operation A has not been started
- The operator cannot start operation B if time T has not elapsed since the start of A
- The operator cannot start operation B if operation A has been started and time T has not elapsed since the start of A
- The operator cannot start operation B if operation A has not been completed
- The operator cannot start operation B if operation A has been completed and time T has elapsed since that moment
- The operator cannot start operation B if operation A has been completed and time T has not elapsed since that moment

Information about whether the operation has any dependencies that prevent the start of production is on the list of available operations. The Status column has been expanded with an additional type: NOT READY. To check the exact dependencies of what needs to be done to unlock a given operation, click on the given row. In the displayed window, information about dependencies can be found on the left in the section: Startup conditions
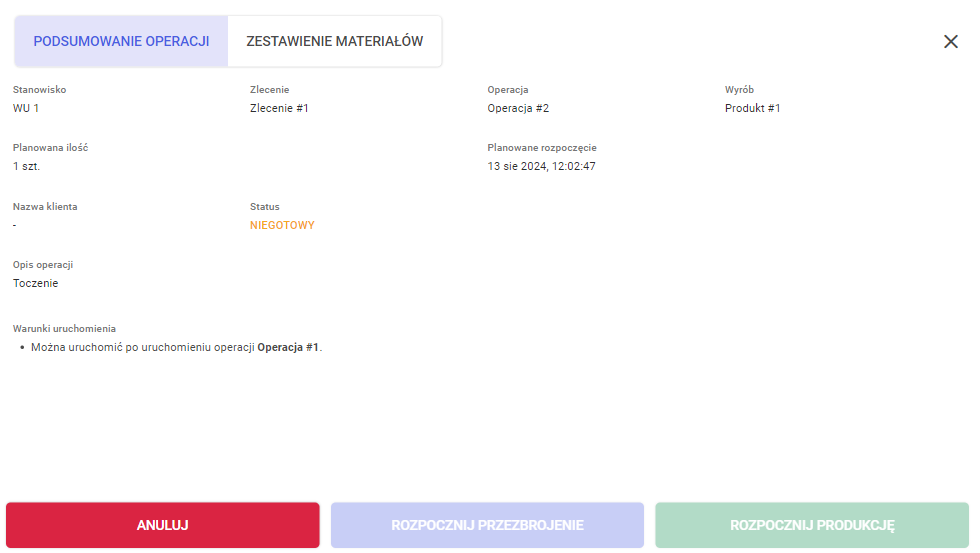
The functionality can be disabled/enabled from the workstation configuration level. The configuration can be changed in the Supervisor application.
Redesign of the material properties and traceability window
In order to increase the comfort of using the Operator Panel, product tracking view (Traceability) and product properties have been rebuilt and made consistent. After clicking on the material tracking icon (QR code icon) – a list is displayed including the Material Name, Description and a button to enter the code manually.

After selecting the option to enter the material manually – the view looks as follows: three columns are displayed: Material Name, Description and a text field for entering the Batch Code.

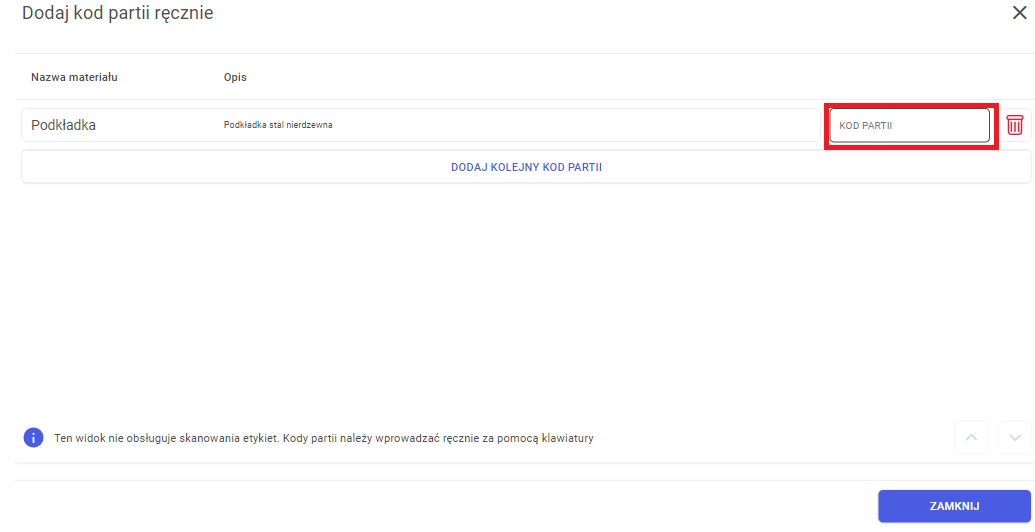
In the case of Product Properties, click the notepad icon. The view is very similar to the traceability view – 3 columns: Property Name, Range Value and a text field for entering the Value. Both windows behave identically after entering the value – the icon on the right changes from a yellow exclamation mark to a green check.

Integration with Comarch ERP Enterprise
Comarch IoT MES 2024.1 offers native integration with Comarch ERP Enterprise. The implemented integration enables reading a production order along with information about the product being manufactured, production operations used in the order, their planned start and end times, and the materials used in them.
Starting work on an operation on the IoT MES side updates its status in ERP. Similarly, in the case of completing the operation. The times of the actual start and end of the operation are also sent to ERP. The quantities of products manufactured in individual operations are also recorded.
