Introduction
Issuers whose securities are admitted to trading on a regulated market in the European Union are required to prepare annual financial statements in a uniform European reporting format (ESEF) for the financial years starting from January 1, 2020.
Statements must be prepared in an electronic format that meets certain technical standards, i.e. a uniform electronic reporting format specification.
As required:
- All annual statements are prepared by security issuers in XHTML format. These statements can be opened and reviewed via a standard web browser;
- Consolidated financial statements prepared in accordance with the IFRS, which form part of the consolidated annual statements, are flagged with the use of XBRL tag-based language (Extensible Business Reporting Language);
- XBRL tags should be added to an XHTML document with the use of the Inline XBRL standard specification. Its basic characteristic is an unequivocal identification of statement line items by referring each of them to a corresponding glossary called a taxonomy;
- The language is based on XML and the related technologies, e.g. XLink; thus, it is not connected with any hardware or software platform;
- A taxonomy to be used is an extension of the IFRS taxonomy developed by the IFRS Foundation;
- From January 1, 2020, the basic sections of a financial statement (i.e. financial situation statement, profit or loss statement, total income statement, cash flow statement, statement of changes in equity) included in the consolidated financial statements prepared in accordance with the IFRS are tagged in detail. Moreover, from January 1, 2022, additional information to a financial statement is tagged collectively.
What is Comarch ESEF?
Comarch ESEF is a web application for creating and viewing financial statements by security issuers from the UE regulated markets in XBRL/XHTML format. The application provides options for creating and composing financial statements in XHTML format, i.e. websites with embedded XBRL tags.
The process of preparing a financial statement can be divided into several stages:
- Configuration: addition of a company, users and their permissions
- Creation of a financial statement or import of a financial statement from a .docx file
- Update and tagging of financial statement line items
- Reviewing of financial statement and taxonomy
The process of validation and export of XHTML file will be added in subsequent program versions.
Configuration
An administrator account will be assigned (and sent) as part of the specified organization unit to the contact person of the client who purchased the application and a number of assignable users will be specified. For safety reasons, it is not possible to register the client in the application.
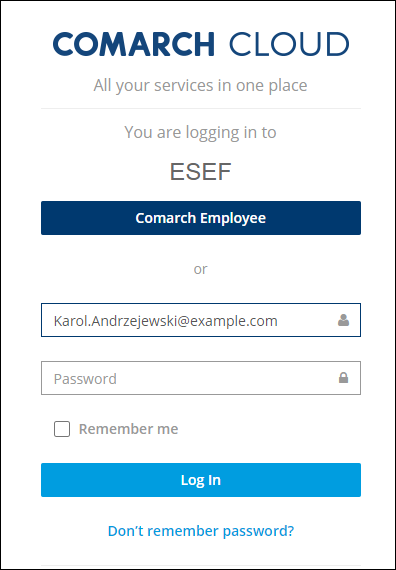
Logon
Logon window
The logon window is presented in the figure below.

Language selection
The application language is selected prior to logon. Comarch ESEF tool can be used in the following language versions:
- Polish
- German
- English
- French
- Spanish
- Italian
Languages available in the drop-down list are presented in the figure below.
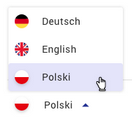
The selected language affects further the system interface language upon logging on.
Login credentials
The application can be used either in demo version or by logging on to own organization.
As mentioned above, it is not possible to register individually to the program. A user with access rights has an account in Comarch Cloud SSO. When attempting to log on, such user will be redirected to Comarch Cloud SSO logon window.
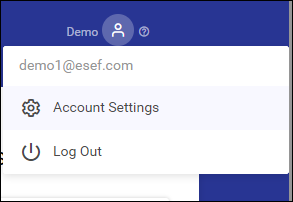
User name
The user name, access to the account settings and a link to the program help are presented in the upper right corner of the screen.

Below the user name icon, there are options for changing account settings or logging out.
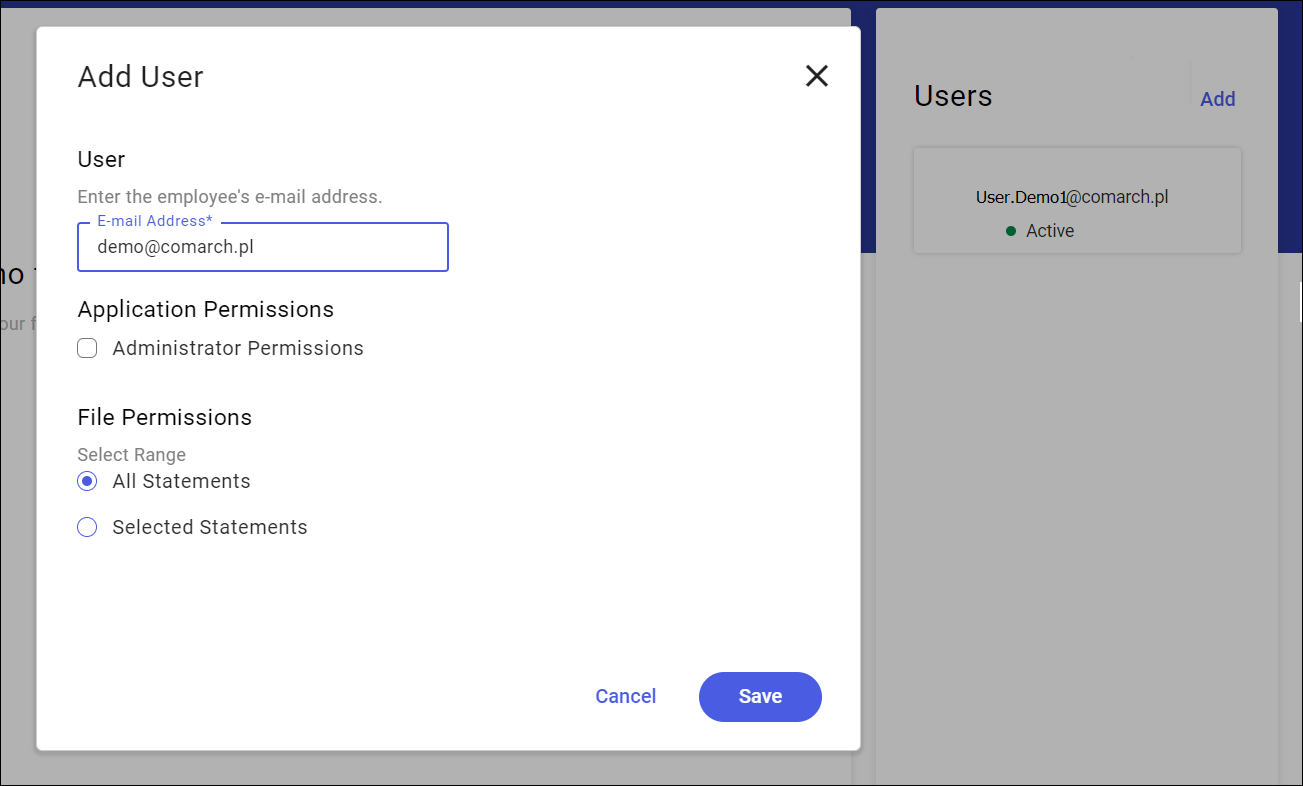
Administrator account and granting permissions
The first user granted by Comarch is flagged as an administrator. This flag provides more possibilities of managing the parameters and data in the application. The administrator account provides the same possibilities as a regular account and allows the following:
- addition and deletion of other application users;
- granting permissions to individual users, allowing them to use specific reports;
- deletion of financial statements.
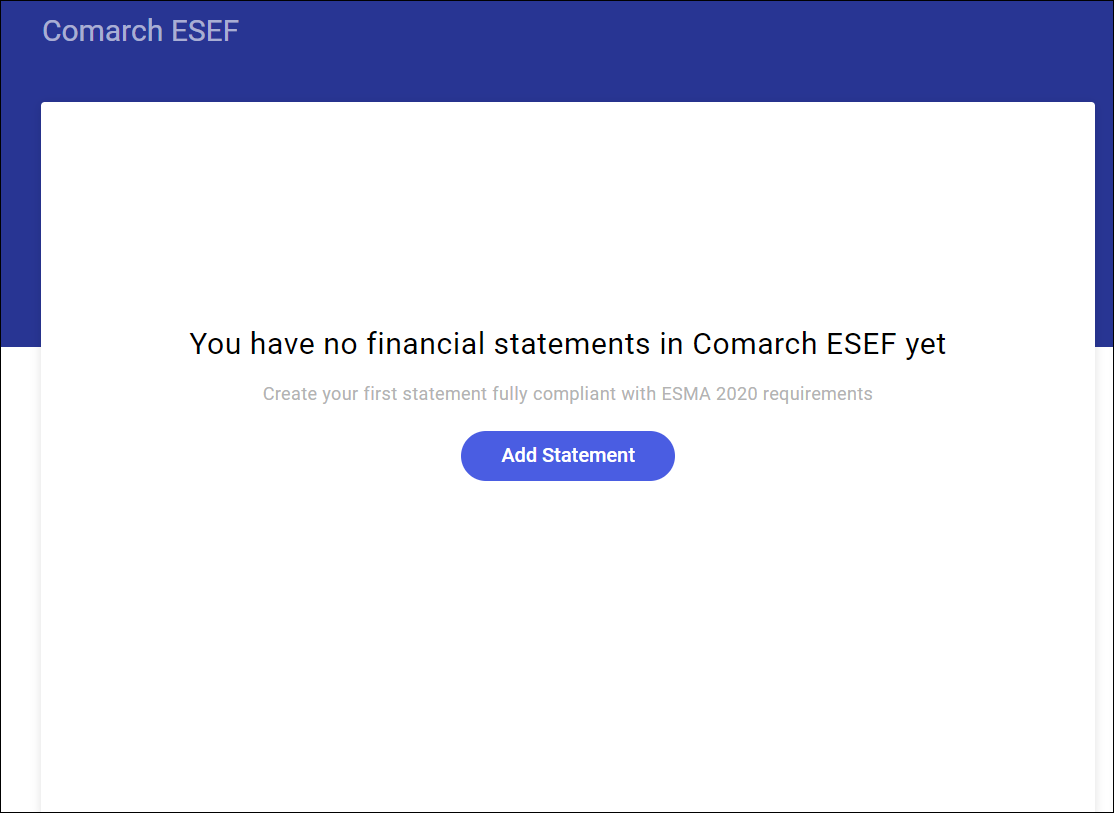
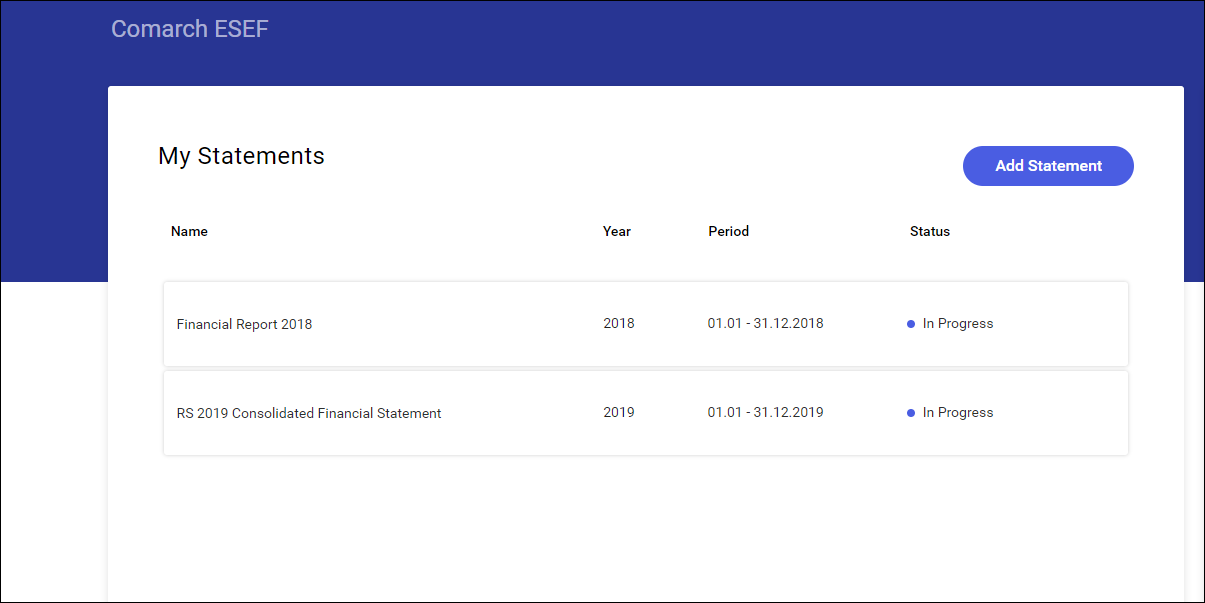
Financial statement list
List of one entity’s statements
The list of statements can be accessed upon logging on. The window view varies depending on the user permissions. An administrator sees an additional administrator dashboard, apart from the window presenting the statement list.
- Empty statement list of a regular user
- List with added statements
- Administrator dashboard
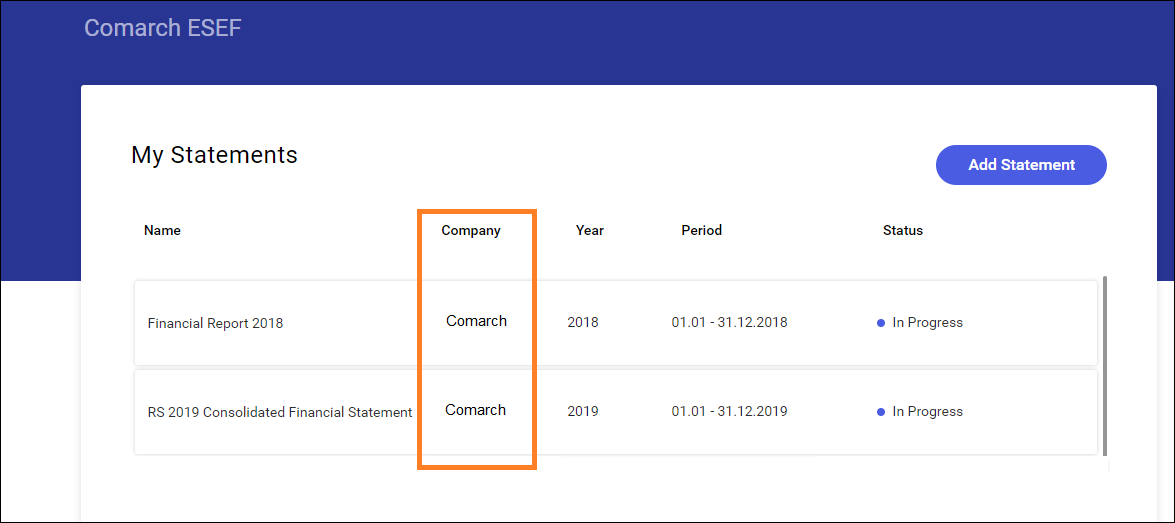
Statement list for several entities
Comarch ESEF application can be used by the entity preparing financial statements as a service for many entities holding different LEI numbers. In such case, the statement list has an additional column presenting the company for which a statement has been added. This additional column will be displayed if more than one company is added for the client.
Adding a financial statement
In order to create a new financial statement, run the statement wizard by selecting the Add Statement button. This is a 4-step statement wizard.
- Step 1 Basic information – company name, statement name, language version and statement country. These fields are mandatory.
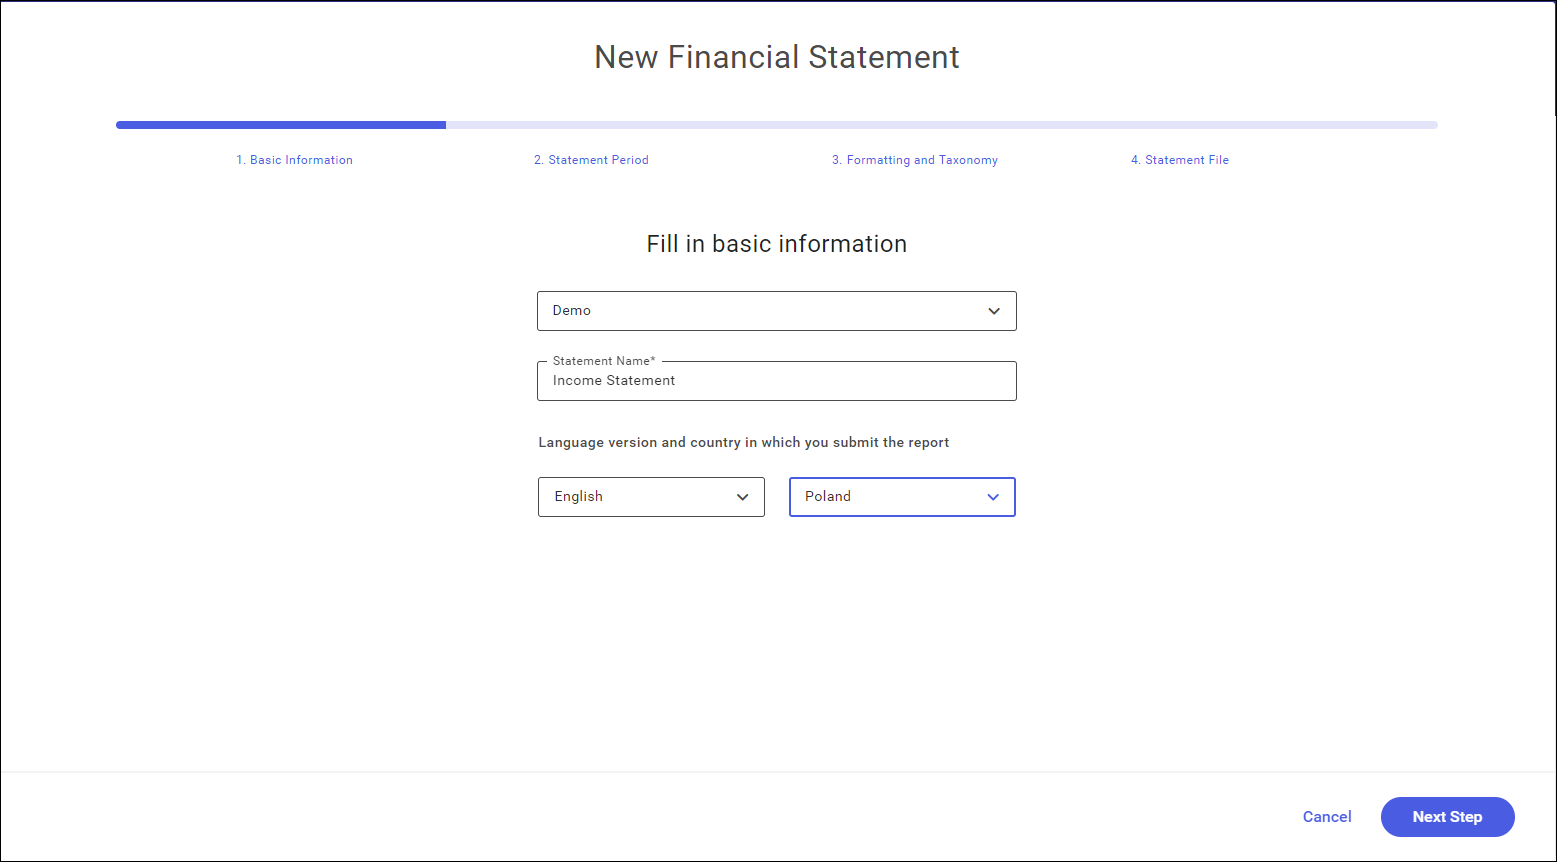
Language selection field will also be presented in the XHTML file header.
The language is suggested by default as per the language version selected while running the program.
Country list is limited to the countries of the European Union. The country is set by default on the basis of the selected language.
At this stage, it is possible to change the language and country selected in the application, as they can be different for the statement being prepared than the language in which the application is running.
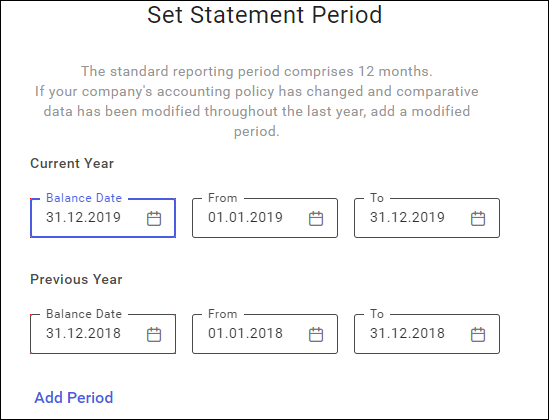
- Step 2. Statement period
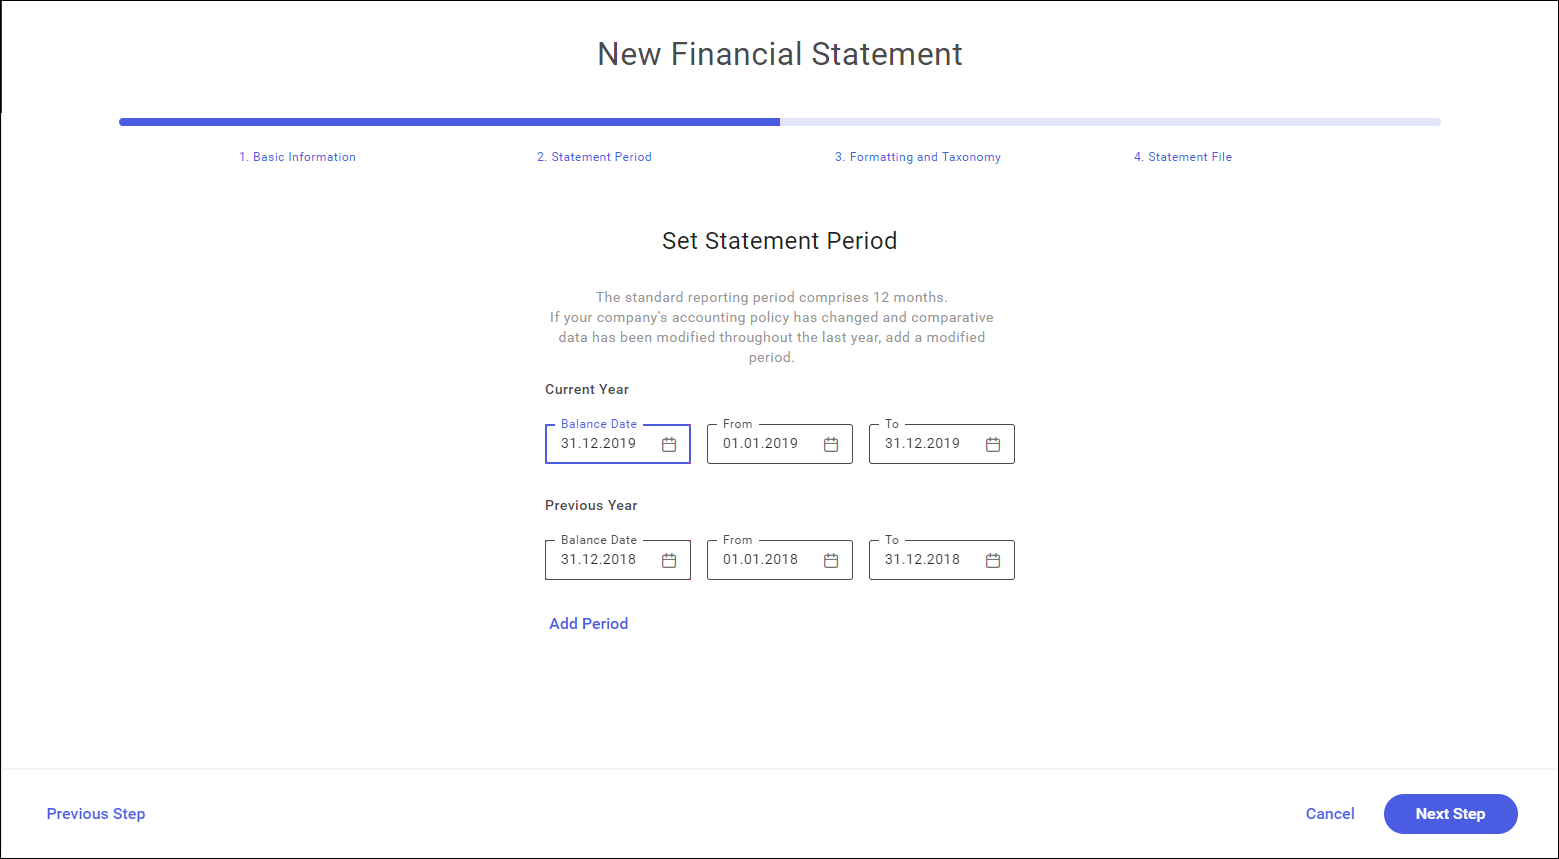
Adding a reporting period for which a statement is submitted.
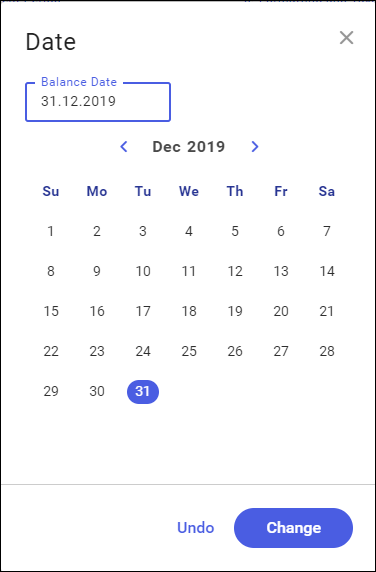
Defining of balance-sheet date – this date is specified by using a calendar that is activated after clicking in the field with balance-sheet date. After the balance-sheet date is specified, the other dates are completed by default.
Current year – it is set by default to 12 months preceding the balance-sheet date. It is changeable.
Previous year – it is set automatically on the basis of the specified range of the current year.
Add Period – in case it is necessary to add another reporting period, a new section ‘Modified Period’ will be added. The dates will be copied from the previous year as changeable. Unlike the previous sections, the modified period can be deleted.
- Step 3. Formatting and taxonomy
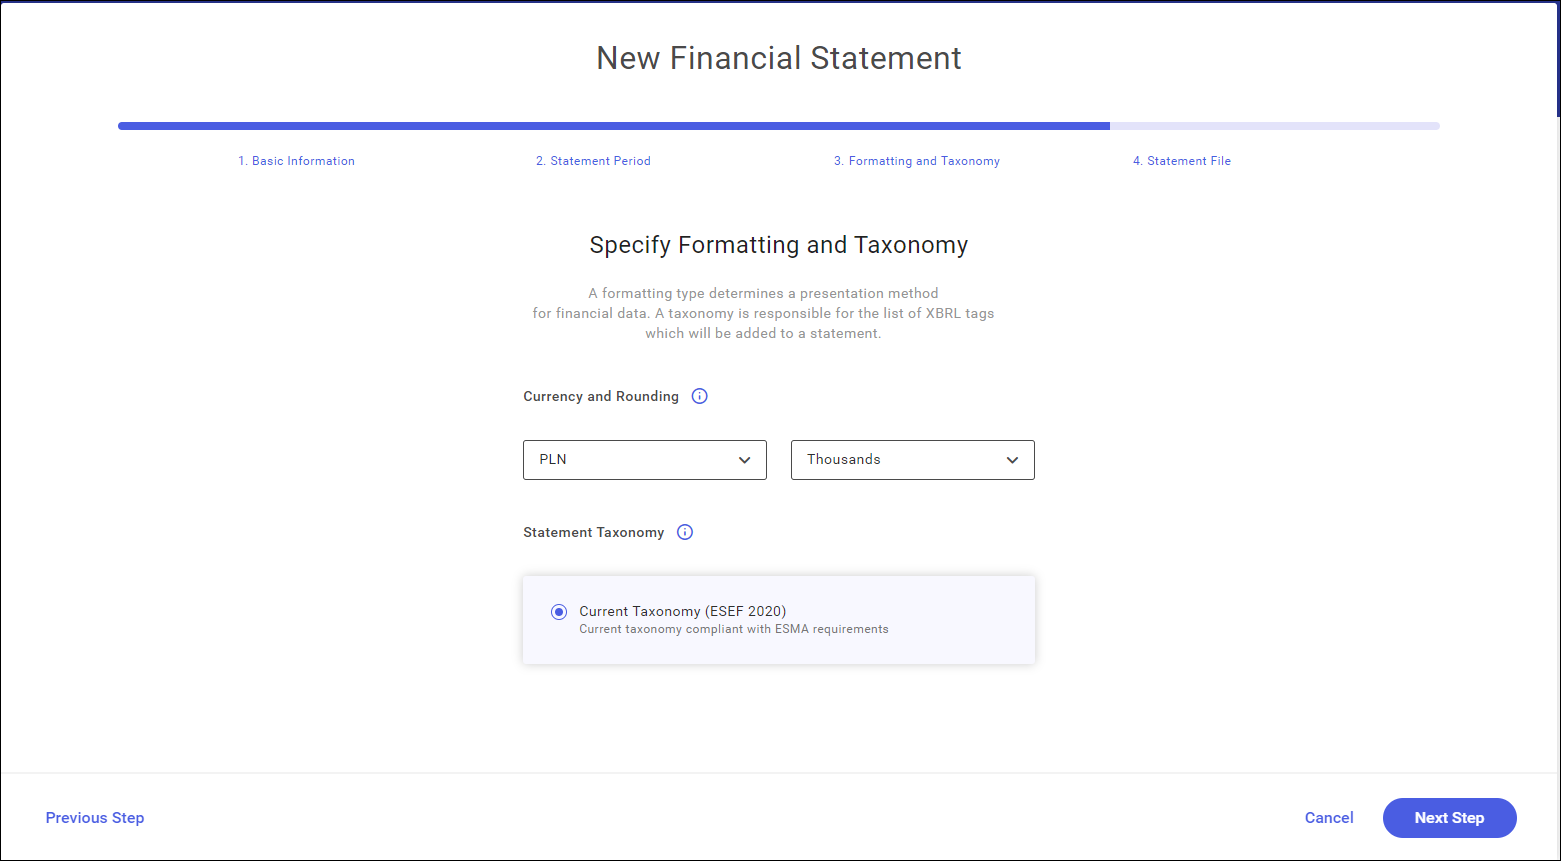
At this stage, it is necessary to select the formatting and a taxonomy that will be used while tagging the statement line items.
Currency – by default, it will depend on the country selected in step 1.
Rounding – by default, it is set to the nearest thousand.
Selected currency and rounding will be assigned by default to all numeric values in the statement. For example, setting the currency PLN and rounding to thousand will present figures rounded to the nearest thousand. These parameters can be changed for individual, indicated amounts in the statement tagging process.
Currently, there is only one taxonomy for a statement available, that is the applicable glossary of tagged data. It is the latest taxonomy applicable in 2020.
Statement Taxonomy – the applicable taxonomy (ESEF 2020)
- Step 4 Statement file
The last stage of creating a new statement is selection of statement creation mode.
A statement can be created:
- as a new document in the application. It is possible to create a custom statement from scratch in the tool;
- by importing a previously prepared statement in .docx or .pdf format;
It is recommended to import a previous statement from a .docx file. This will save a lot of time as you will use an already prepared statement to create own one. Using the .docx format provides more edit possibilities than the import from a .pdf file.
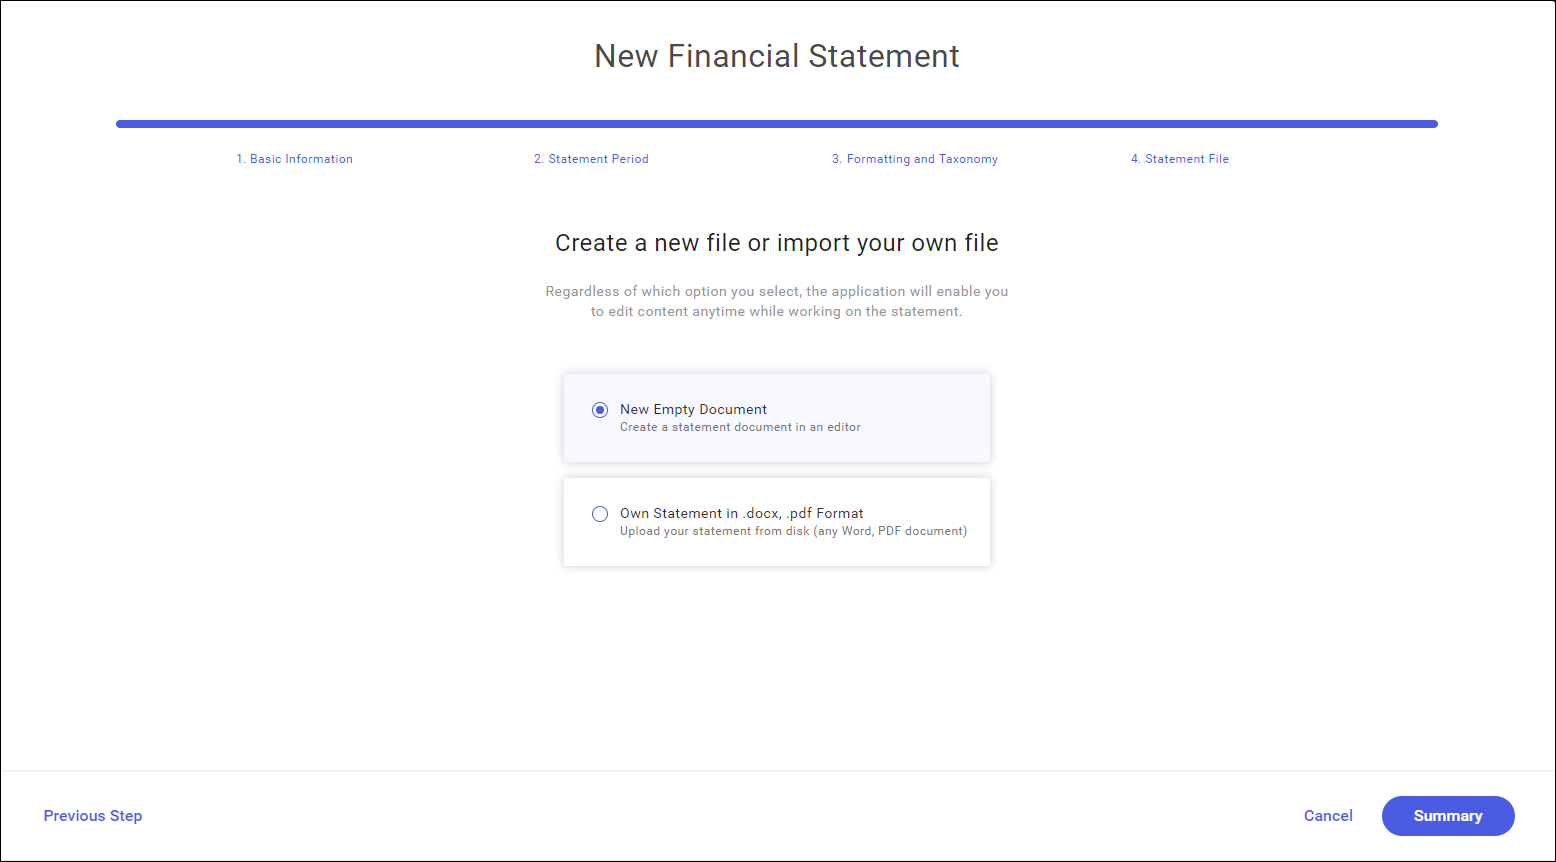
A custom statement in .docx format must be selected by default. Selecting the Select File button opens a file selection window from the hard drive. Selectable files are limited to docx and pdf formats.
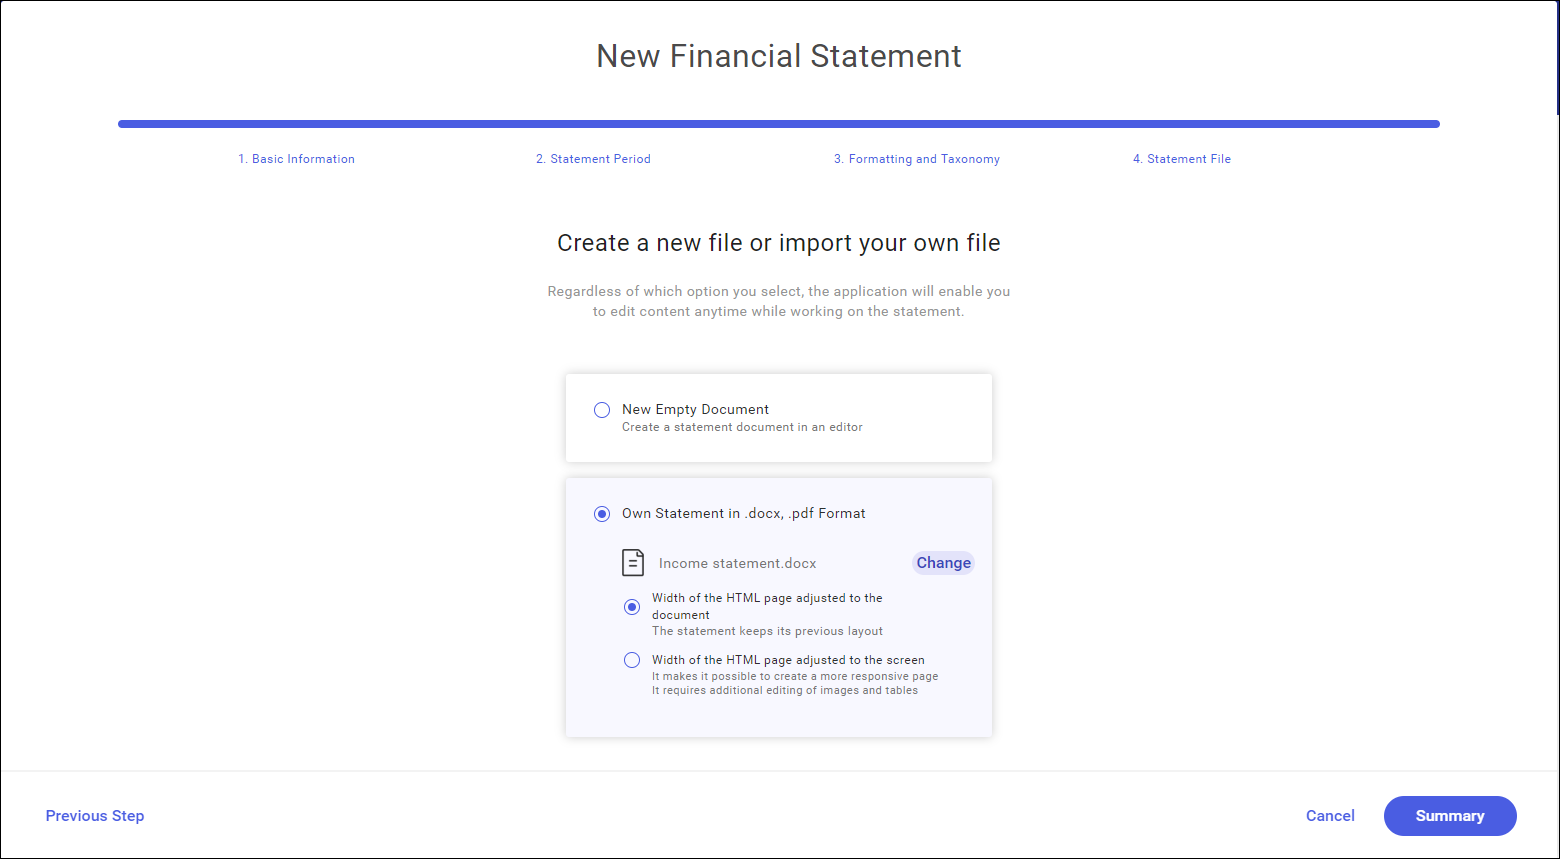
The statement file will be uploaded right upon its selection.
When importing a statement, the following options can be selected:
- “Width of the HTML page adjusted to the document”. If selected, the statement retains its current layout and is not scaled to page width.
- “Width of the HTML page adjusted to the screen”. This variant can be used to create a more responsive page. This solution may require additional edition of graphics and tables.
Creating a financial statement based on XHTML technology according to the ESMA requirements makes possible to create more interactive and legible statements than PDF. A statement can, for instance, be rescaled to the size of its previewed version, which makes it easier to read it on devices such as tablet or smartphone. However, this requires a lot of work at an earlier stage. The default page width limit makes it much easier to convert a DOC document into HTML and retain its current visual form.
This is the last step of statement creation. Selecting the Summary button opens a window presenting the completed stages of statement creation.
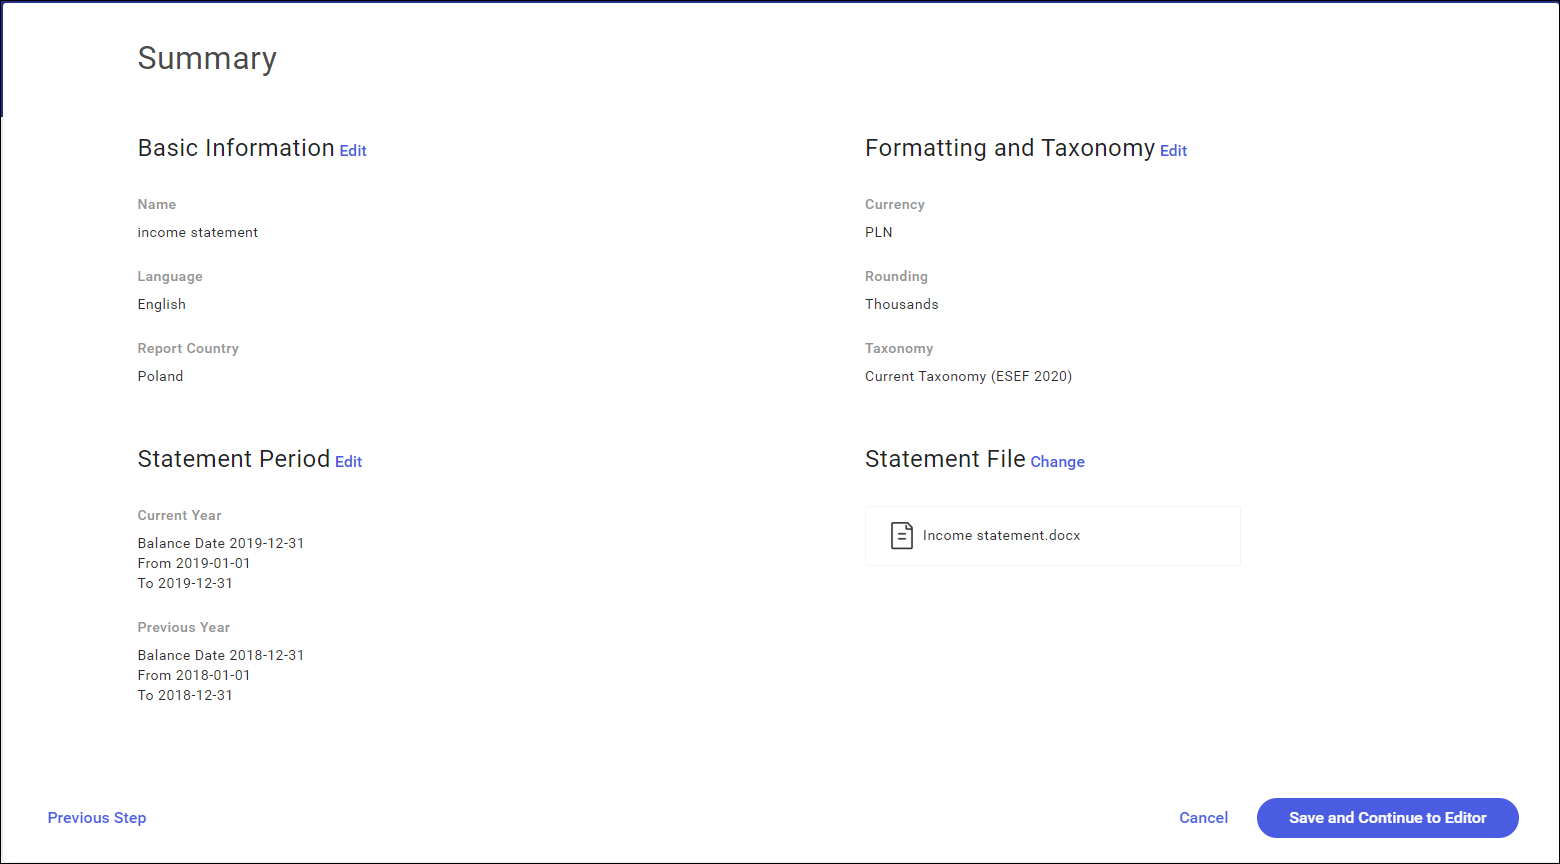
In this window, you can go back to the previous wizard steps and change the selected parameters using the Edit or Change buttons. After going through all the steps, you can return to the summary window by selecting the active Summary button.
Save and Continue to Editor displays the financial statement in XHTML view, that is as an editable website.
Statement edition
Editor window
According to the ESMA (European Securities and Markets Authority) requirements, financial statements must be prepared in XHTML format, which is a more restrictive version of HTML language.
In case of selecting a .docx or .pdf file as the source of the financial statement, the file in the background will be converted to XHTML format.
In Comarch ESEF application, it is possible to edit a website in a way known from conventional text editors such as Microsoft Word. With the editor, it is possible to manipulate a text, e.g. by adding bolds or changing its color or orientation on the screen.
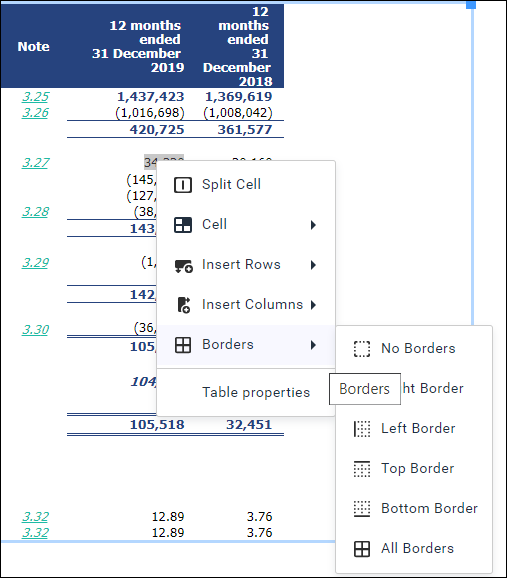
Because financial statements are composed mainly of tables, more options to work with tables have been added. After selecting the table cells and clicking the right mouse button, it is possible to:
- merge / unmerge cells
- insert and delete rows
- insert and delete columns
- edit cell formatting, e.g. change their background
- add and delete cell borders
HTML edition
Using the website view, data in financial statements can now be presented in ways that were not previously available, such as highlighting the table rows being viewed. Thanks to the option of editing the source HTML code, advances users can configure their financial statements comprehensively.
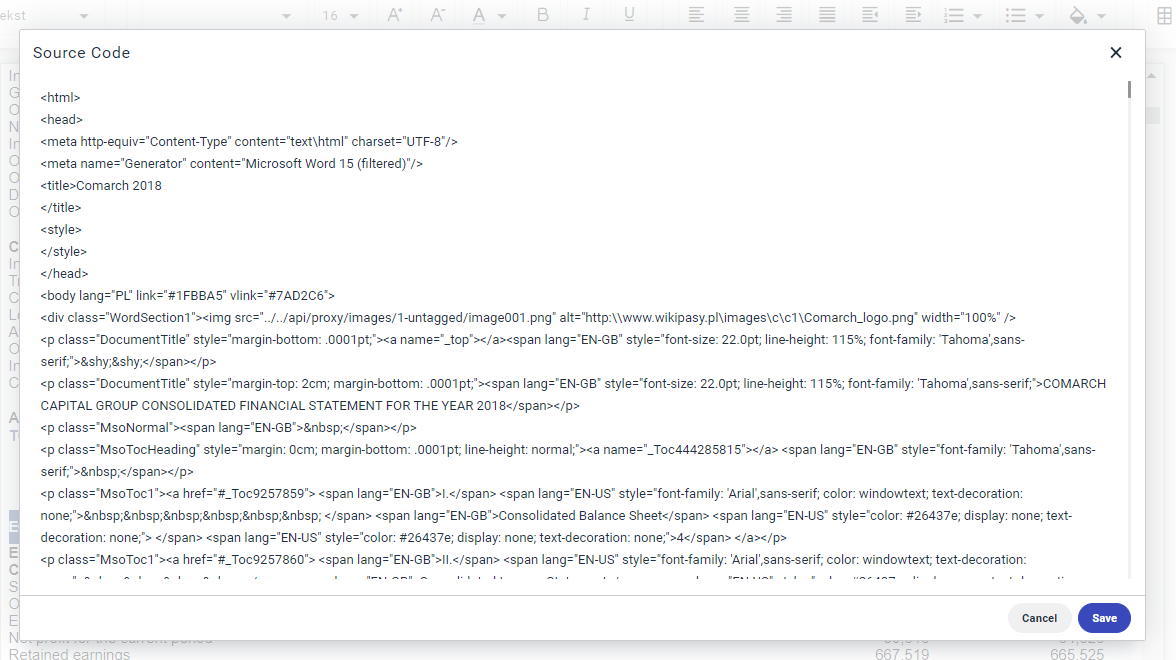
A relevant switch is available in the lower right corner of the screen.
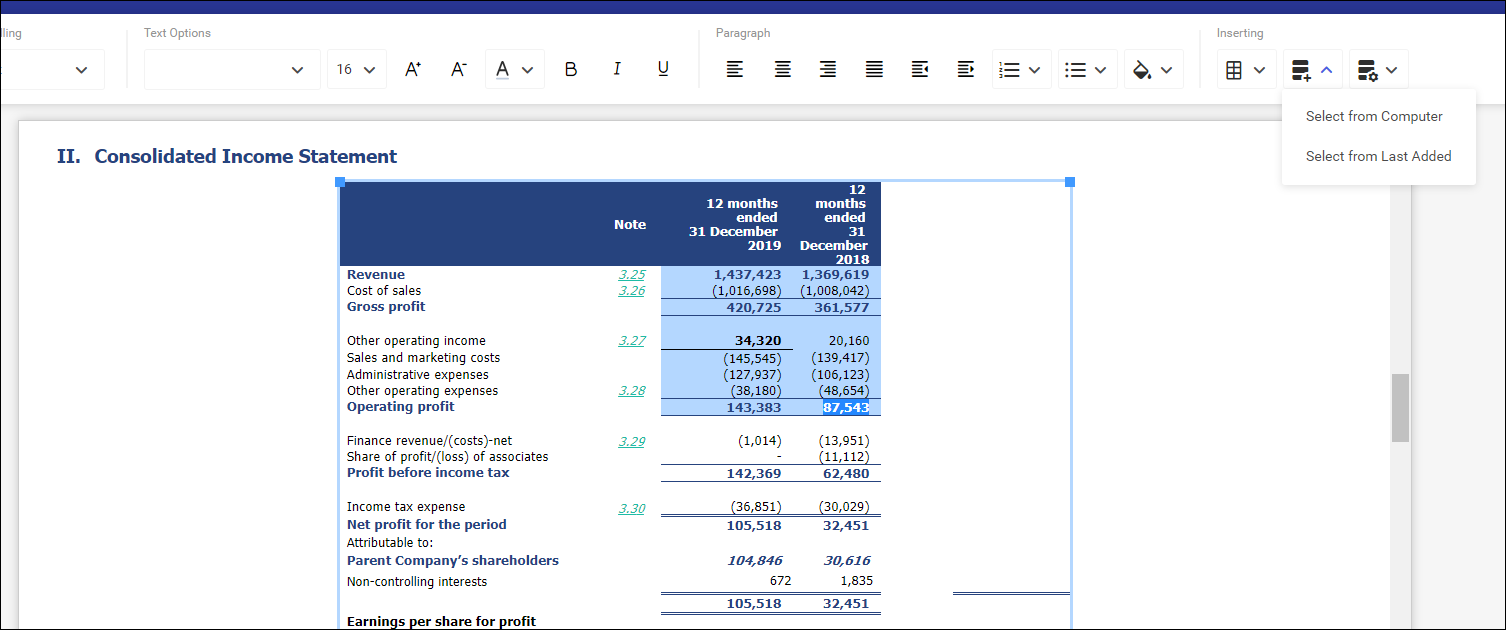
Import of data from Excel sheet
Data in a financial statement may constantly be changing before the statement is published. To ensure that this data is updated automatically, it is now possible to import tabular data directly from Excel sheets.
Selecting data to be updated
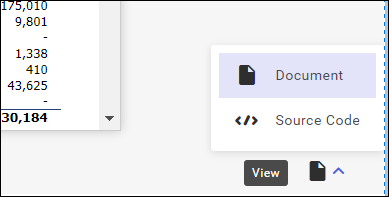
After selecting cells in a table, they can next be merged to an Excel sheet with the relevant merge option. Cells are merged by selecting the option Select from Computer available under the Upload Data Source ![]() button.
button.
Installation of auxiliary application
In order to create connection between an Excel file on disk and the server application, it is necessary to install an additional software Comarch ESEF Agent. It is responsible for creating and securing communication between the spreadsheet and the statement. This way the file does not need to be stored on the server. Only the data selected by the use are uploaded. The rest of the file is stored safely in the local resource.
If the application is not installed, a relevant notification to install it will be displayed:
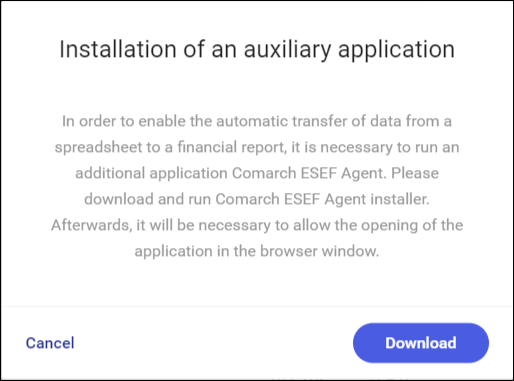
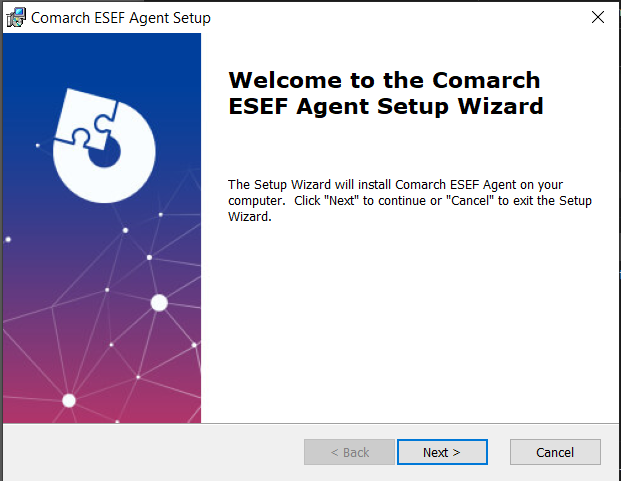
After selecting the option Download, Comarch-ESEF-Agent.msi wizard will be downloaded onto your hard disk. Open it and then proceed with the installation.
After the auxiliary application is installed, it will be possible to refer directly to Excel sheets.
Creating named cell ranges
Comarch ESEF application gets information only from named cell ranges in Excel. This is due to make working with the spreadsheet more flexible – such a table can be dragged (e.g. by adding rows) without affecting the correctness of the import.
In order to create a named cell range, select in a spreadsheet a fragment of a table and then go to Formulas / Defined Names / Define Name and type a name for the selected cells.
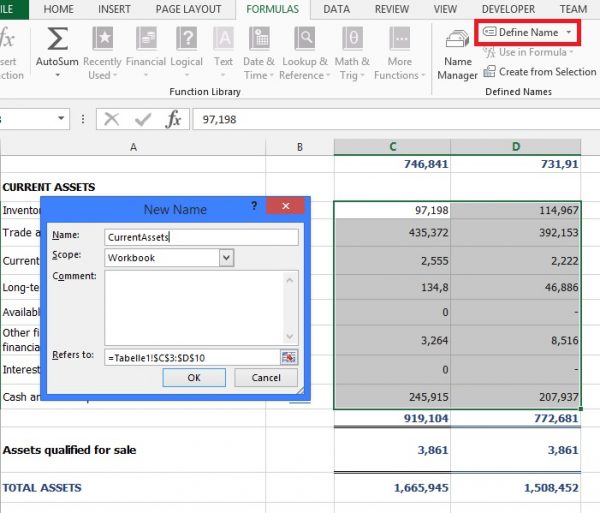
After the spreadsheet is saved, the selected names are ready to use in Comarch ESEF application.
Selecting a data source
Selecting the option Create Data Source will open the Windows window asking to select an Excel file. The application will search the spreadsheet in terms of the defined cell range names and will display them on the screen.
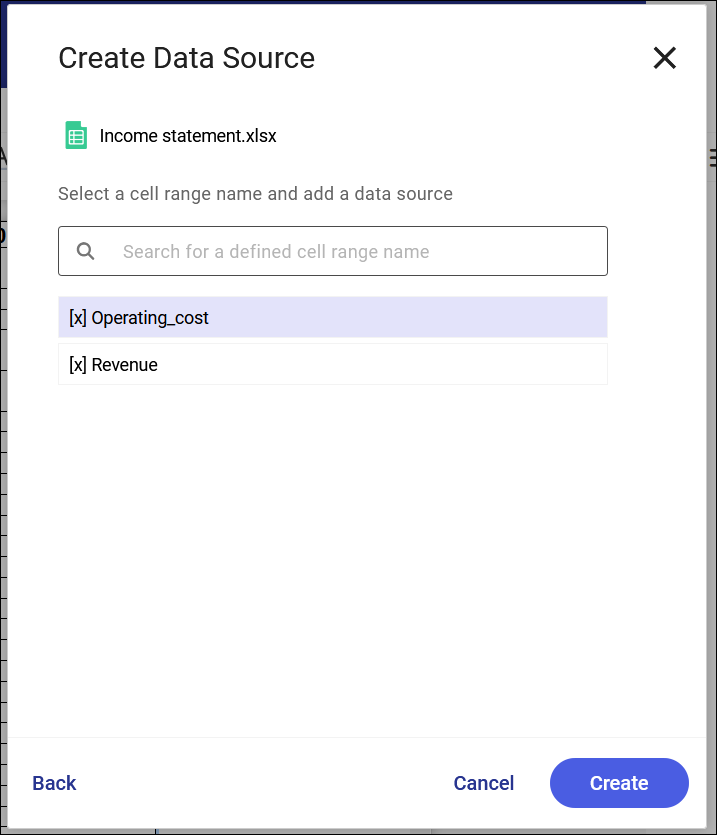
The system checks the conformity of the size of the selected cell range in Comarch ESEF and in the Excel file. In case the size does not match, a sequence [x] is added to the cell range name. Such name cannot be assigned to the selected cell range.
A relation is created upon selecting the Create button.
Updating values
In case the source data is changed, it is possible to update the data in Comarch ESEF. To do this, select any cell from the linked table and then the option Update Values under Data Sources.
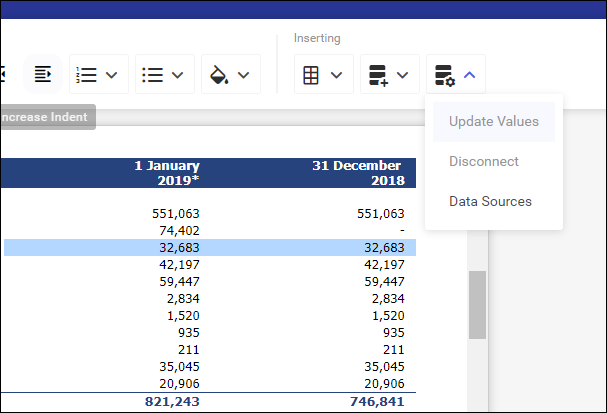
If XBRL tags were already assigned to a cell, they will not be lost. Only the values listed in these tags are updated.
Breaking data source
If a link to a given spreadsheet is no longer needed, it can be discontinued by selecting the option Break available under the Data Sources button.
Tagging of financial statements
To be able to flag a financial statement with XBRL taxonomy tags, in the statement edition window, select the button: Go to XBRL Taxonomy to proceed to the next step.
The button is available in the upper action bar of the statement edition window.

Tagging a statement with XBRL taxonomy
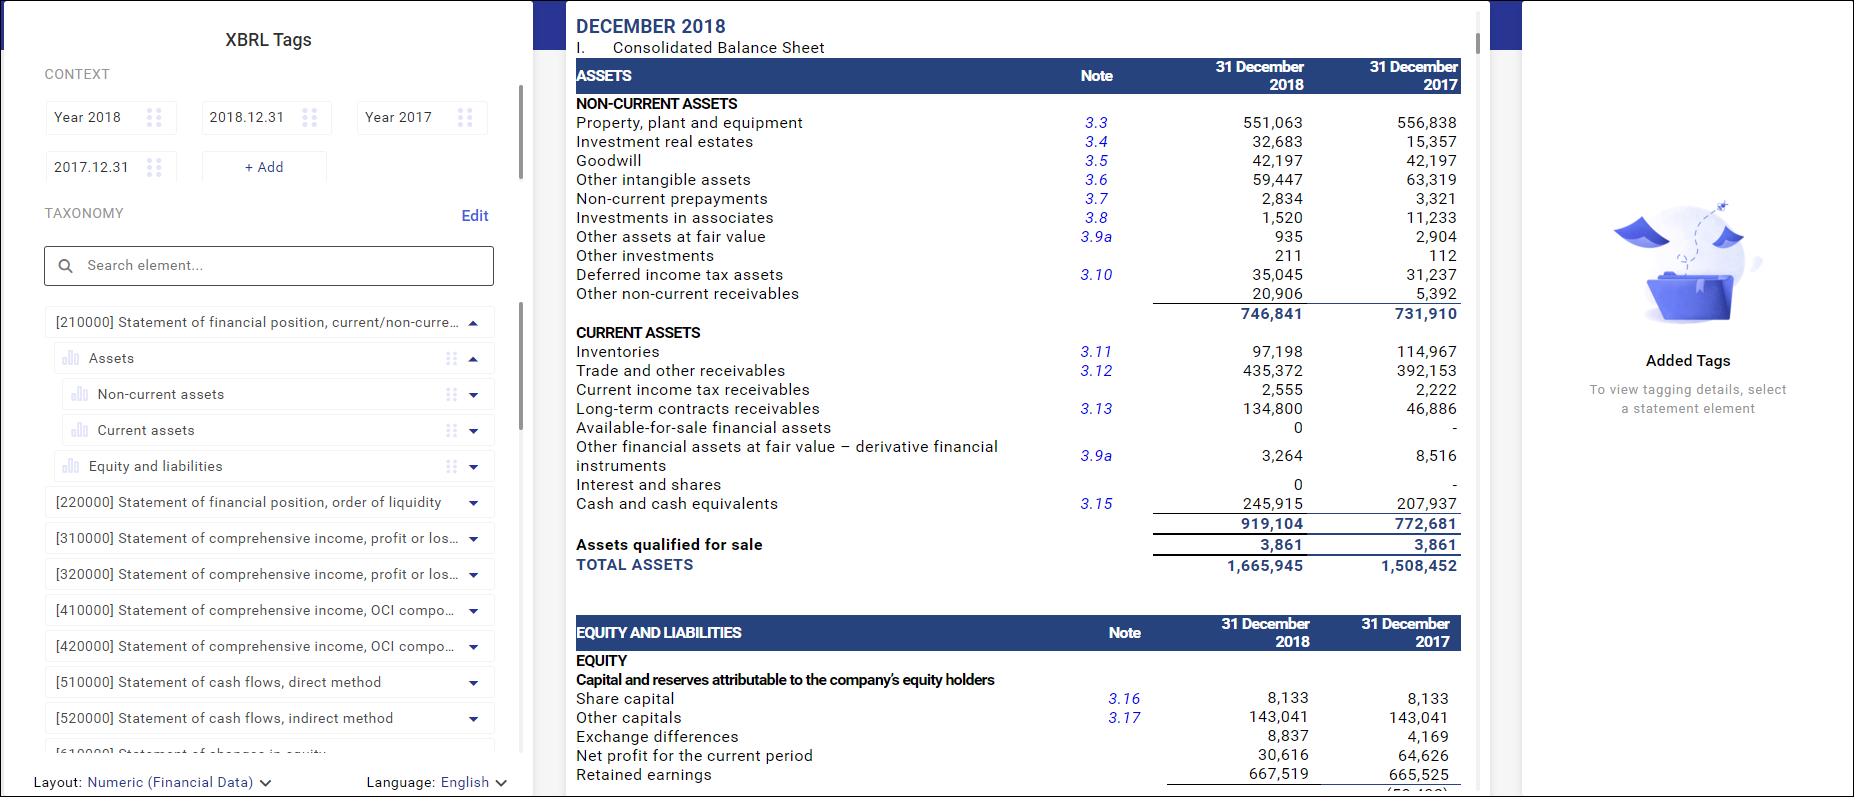
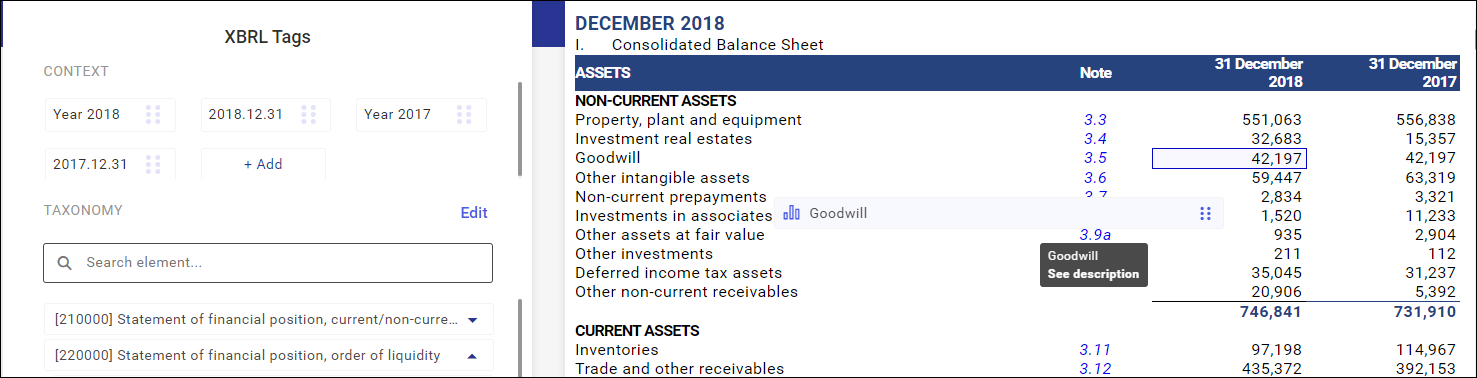
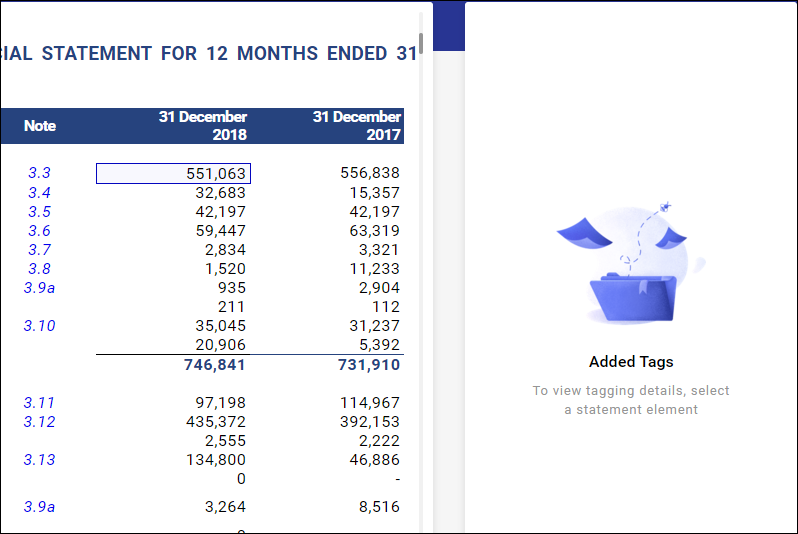
The screen in which financial statement line items can be flagged with XBRL tags is composed of 3 sections:
- section: XBRL Tags (on the left)
- section with a financial statement – the proper tagging screen (in the middle)
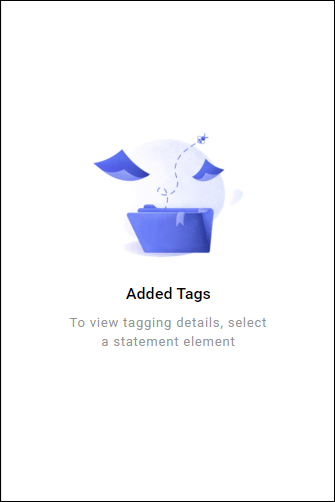
- section: Added Tags with listed tags assigned to the selected line item
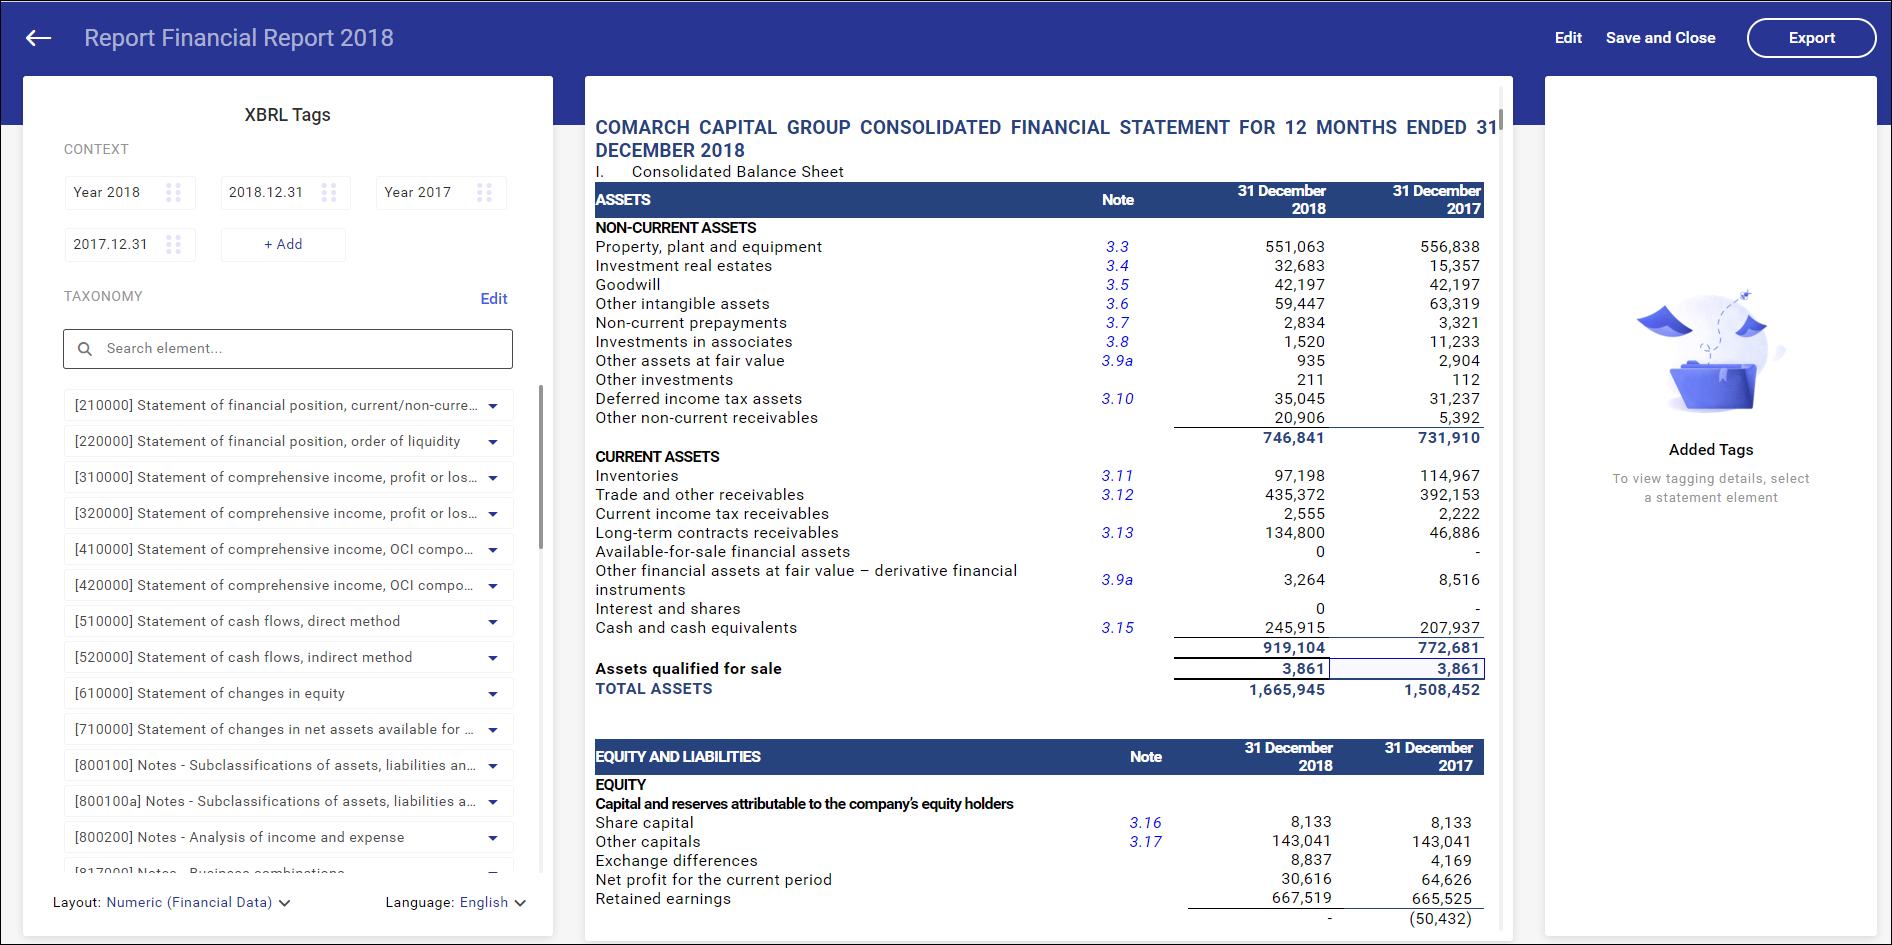
XBRL tag list
Context-based tags
The context places an element of taxonomy in time and location; thus, it determines the company and period a given value (e.g. revenue from the provision of services) refers to.
- Company
A company is identified with a unique Legal Entity Identifier (LEI) that can be verified, for instance, at this address https://www.gleif.org/en/lei/search/. A LEI number is provided during registration of an entity in the application. Information about LEI number is granted in the context-based tag automatically in the background – no user interference is required.
- Time
Elements of a financial statement can be defined for a specified moment in time, e.g. cash and cash equivalents as at December 31, 2019. Other elements may refer to the values for the whole year, such as sales revenues obtained in 2020. Hence, normally there are 4 periods applied in the application. In case a financial statement is being prepared for 2019 and compared with data from 2018, its contexts will be the following:
Date range: current year – 2019
Date range: previous year – 2018
Current date – 2019-12-31
Previous date – 2018-12-31
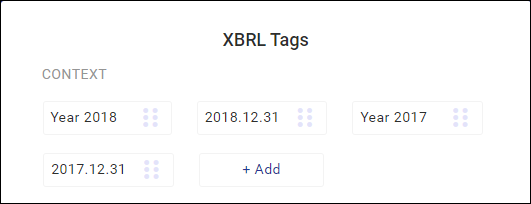
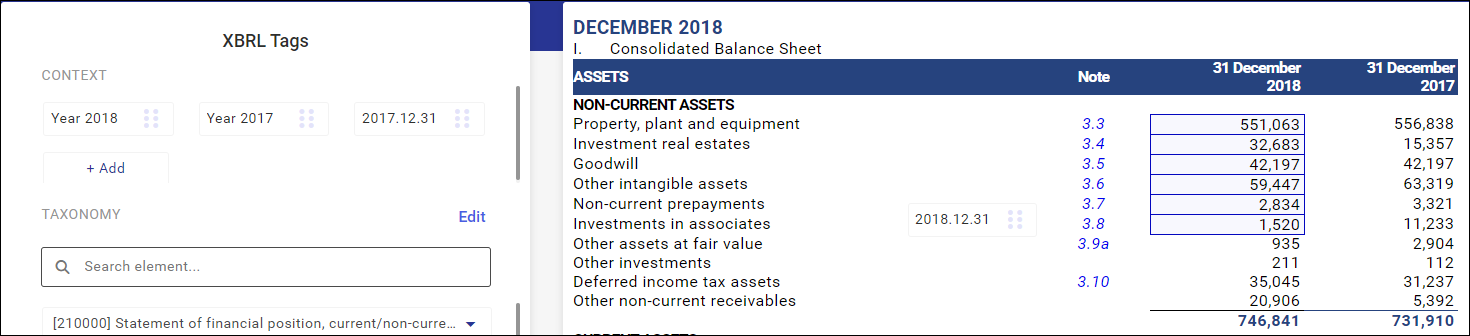
Adding a context while preparing a financial statement
Sometimes, when preparing a financial statement, it is necessary to add a new context, that is a period the reported information refers to. This may be due to the necessary transfer of the line item value at the beginning of a comparable period.
A new context can be added by selecting the Add button available on the context list in the tagging screen.
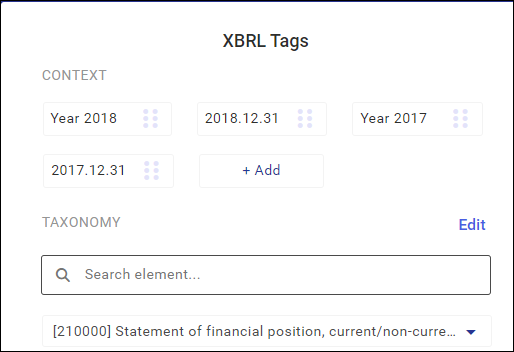
After selecting the Add button, you may specify whether the new context refers to a balance-sheet date (e.g. in the case of the financial situation statement) or to the whole period (e.g. in the case of the cash flow statement).
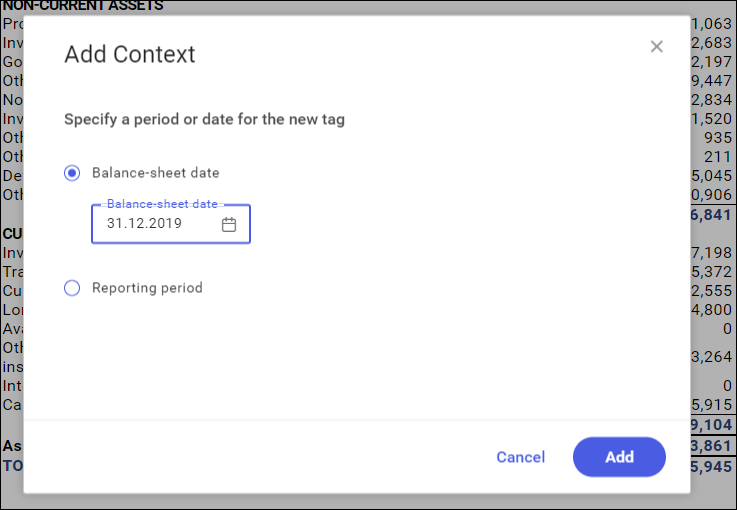
The newly created context will be displayed on the list of available contexts.
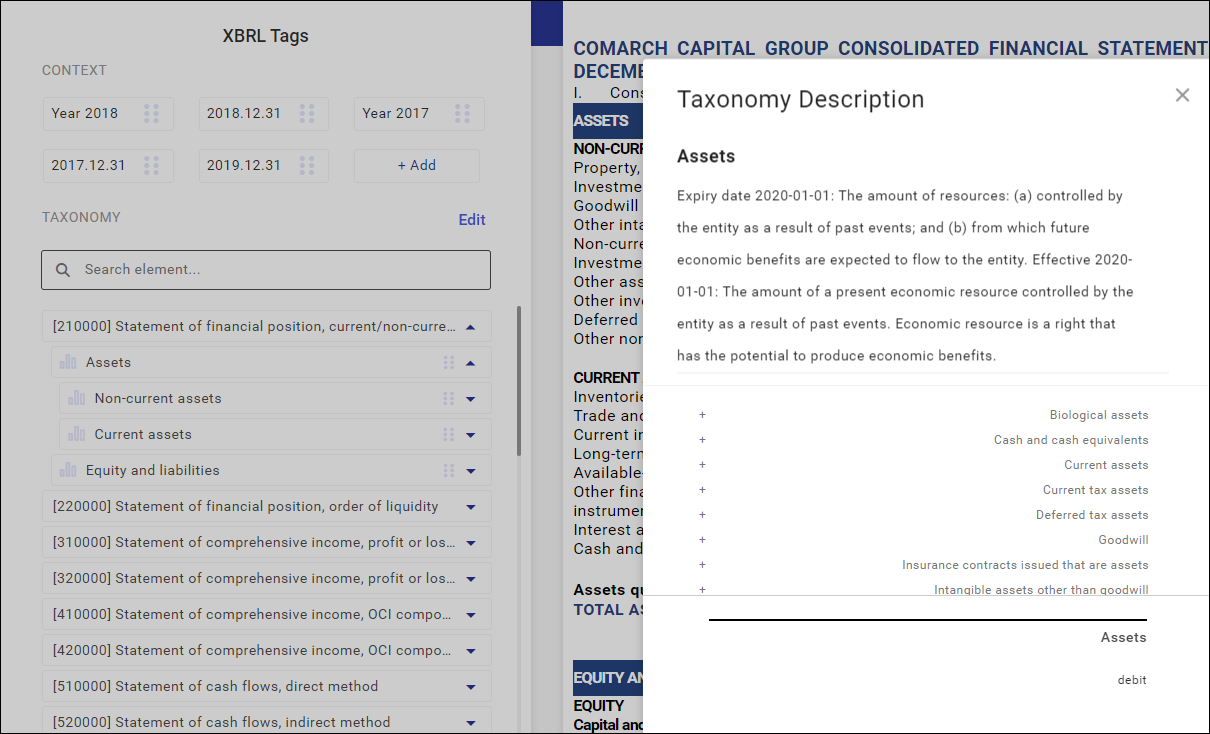
Taxonomy
General information
- The ESEF taxonomy is a glossary with terms delivered by the regulatory body ESMA (European Securities and Markets Authority). Each financial term has a unique identifier assigned, which can be used to describe an economic event. This identifier is independent of the language in which a financial statement was prepared. This allows comparing the information from different companies operating on the continent without knowing the language in which a given financial statement was prepared. In order to make it easier to understand the tags, each of them has
- a user-friendly name
- detailed description of line items
- reference to relevant legal documents (number and article of the relevant standard of the IFRS)
- the numerical relationships between the taxonomy elements (e.g. total assets is a total of fixed assets and current assets), a so-called calculation
- The regulations are applied in the European Union, therefore, the ESMA has provided translations of all the elements into local languages. All those translations are available in the program.
- Another characteristic of the taxonomy is a relationship between its individual elements. Owing to the network of many interconnections, the taxonomy tree can be viewed in several different ways. The main connection networks are:
- presentation layout – includes all terms available in the taxonomy
- numerical layout – includes only the terms with a number assigned. The layout is also more consistent with the rules of numerical relationships between these elements.
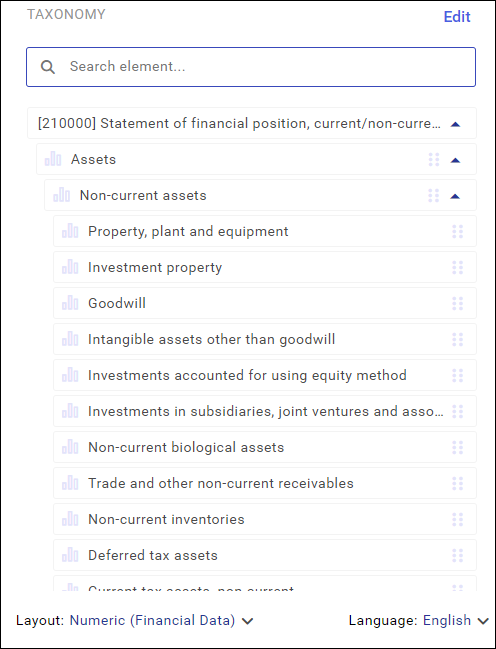
- To make it easier to browse this glossary, it has been divided into the roles that most often correspond to sections of the financial statement (they start with a series of digits). Each of these roles is additionally divided into sets that group the related elements. Grouped elements cannot usually be used to tag a financial statement, therefore, it is possible to drag these sections to the tagging screen.
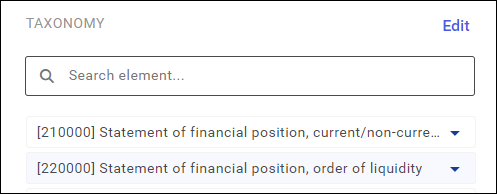
Taxonomy list
A taxonomy list contains a valid glossary referring to financial statement types and the regulated information.
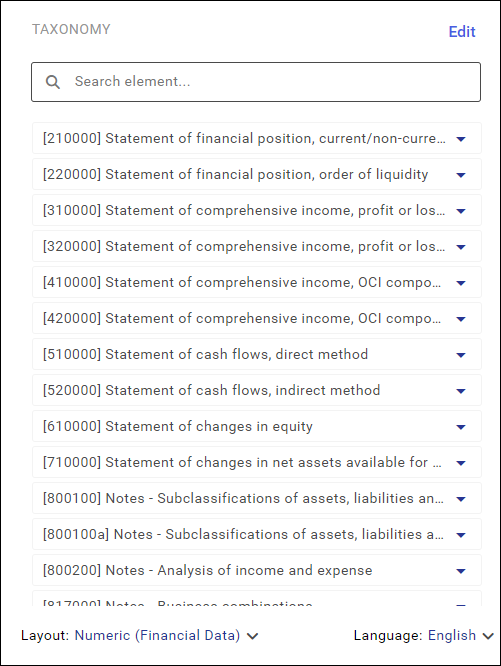
- Taxonomy tree
A taxonomy list has a tree structure. Individual elements of the tree are expandable. The list line items can be expanded by clicking on the arrow symbol on the right.
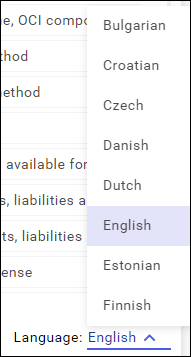
- Taxonomy layout and language
The language and layout of the list is changeable. They can be changed by using the options: Layout (figures, presentation data) and Language (EU languages) available below the list.
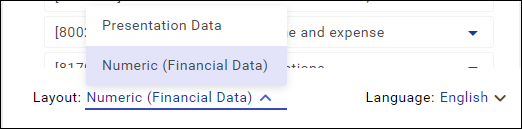
The presentation data contains the entire taxonomy glossary that makes possible to tag text values as well as an additional classification of figures (so-called dimensions).
The numerical layout is a taxonomy version limited to figures. It is used to describe most of the line items in a financial statement.
- Filtering of the list
The taxonomy line items on the tree are searched for with the use of the filter. Typing a text in the search field limits the list and searches for those elements whose names contain the typed texts.
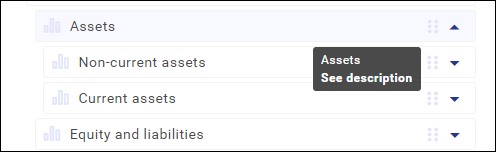
- Description of line items
If the value of the taxonomy line item description is longer than the window size, the full description can be previewed after hovering the mouse cursor over the line items.
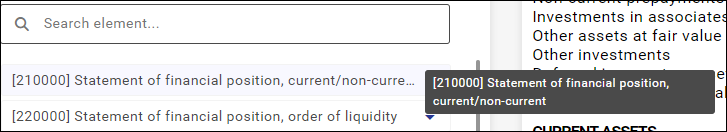
If a documentation is attached to a given line item, then clicking on the line item activates the information See Description.
Taggable data in a financial statement
A financial statement is presented in the middle section, where it is also possible to flag line items with XBRL tags. In the tagging mode, it is not possible to change amounts and edit texts (this can only be done back in the XHTML statement edition view).
Adding tags – tagging process
The tagging process itself consists of 3 actions:
- Selection of financial statement line items
Line items are selected after clicking the left mouse key on the line item indicated by the mouse cursor. The entire line item is then bordered. It is also possible to select line items in a single batch with the “Shift” or “Ctrl” key. This makes the tagging process simpler/faster.
- Dragging of taxonomy terms into the highlighted area (“drag and drop” method)
Find a proper tag on the taxonomy tree and then drag it onto a statement with the left mouse button. If you drop the selected tag on the area with the taxonomy glossary, the tool will not tag the previously selected data in the statement (this prevents tagging of unintentionally selected taxonomy line items).
- Dragging of context onto the selected area, which places the concept in time.
In section with the context tags, use the left mouse key to drag the right context with which a line item of the financial statement will be tagged.
Tagged line item view
Tagged line items are tagged with a dot symbol.
- Orange dot indicates incomplete tagging – either a taxonomy or context is missing
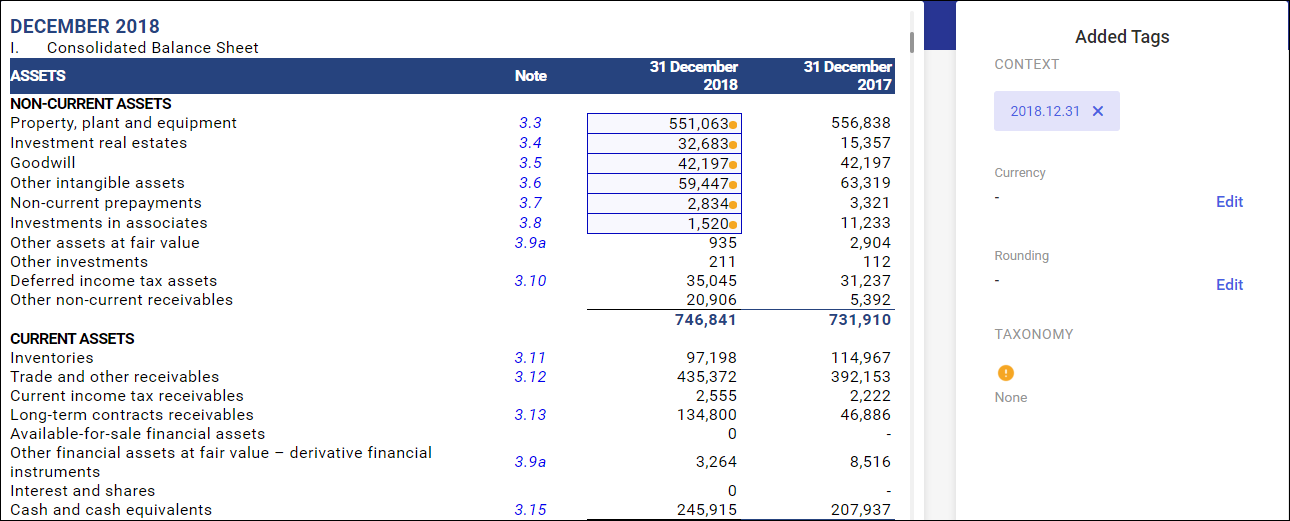
- Green dot indicates complete tagging
If both a context and a taxonomy are assigned to the statement line item, it means that tagging is complete, which is confirmed by the green dot symbol.
Added tags window
Added tags review
In section ‘Added Tags’ on the right, it is possible to review the tagging of a given line item. Content presented in this section depends on the content of the selected statement line items.
The section with figures with no tagging was selected or the section with or without tagging was selected at the same time.
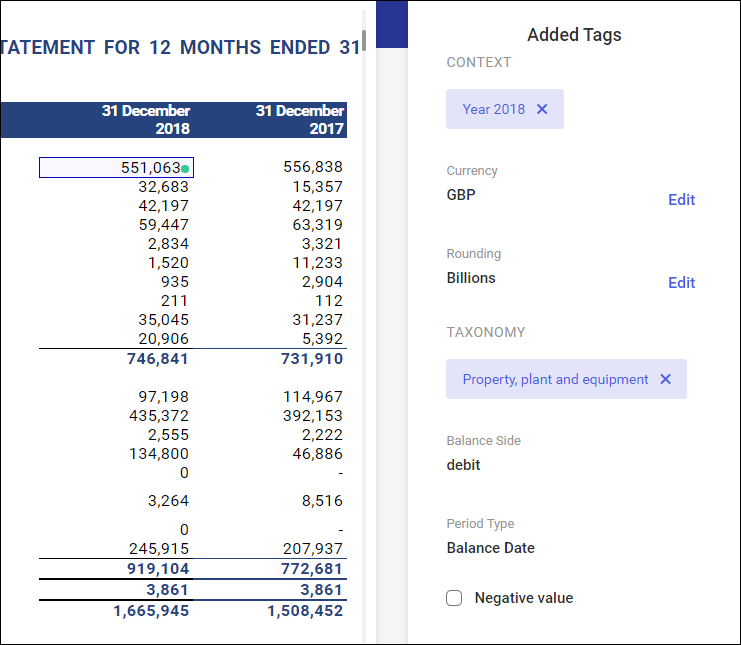
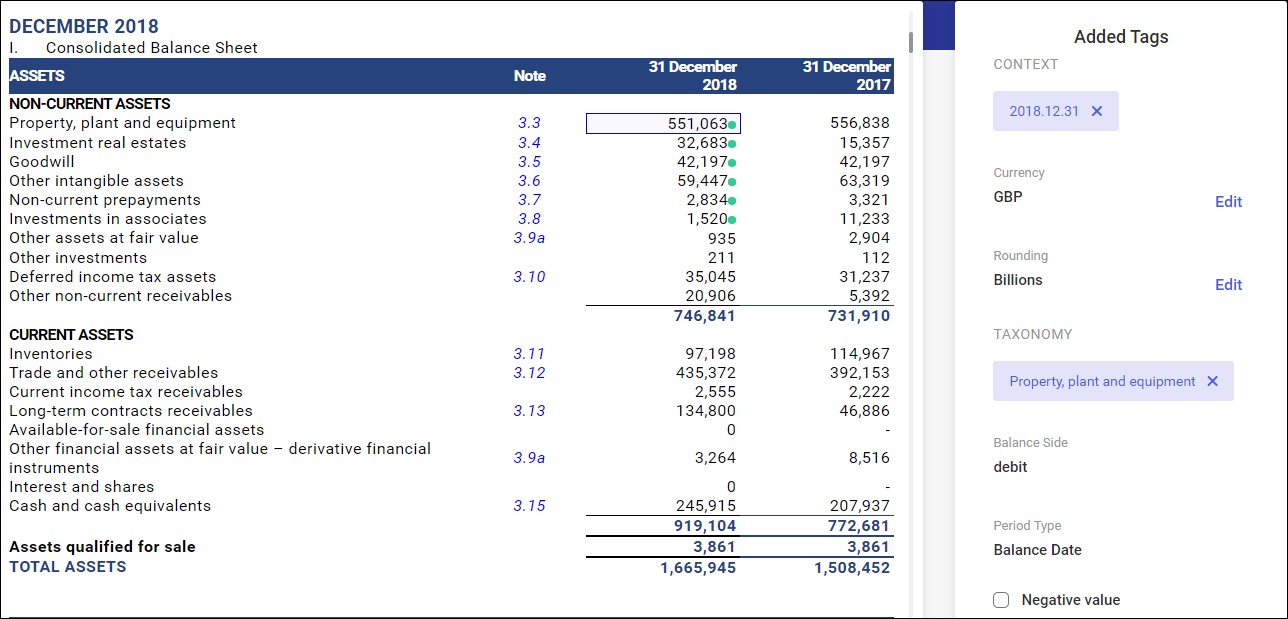
Edition of added tags
In section on the right, it is also possible to edit the tagging settings by:
- Deleting the entire taxonomy term or context with the X button.
Deleting a taxonomy tag will delete the numeric attributes: currencies and round figures.
- In the case of numbers, it is also possible to edit a currency or a round figure by using the Edit button.
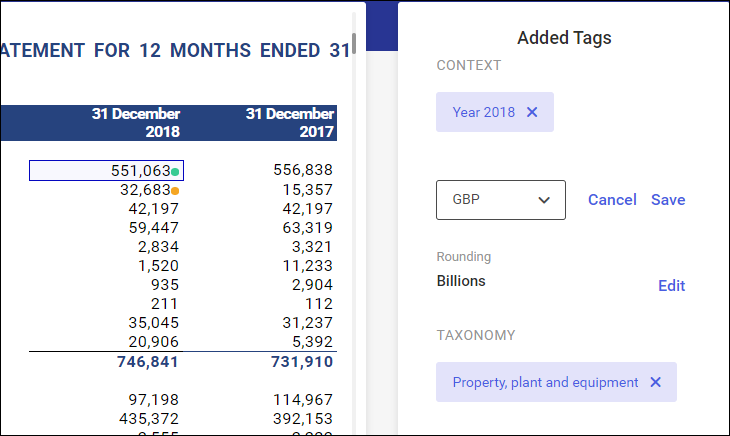
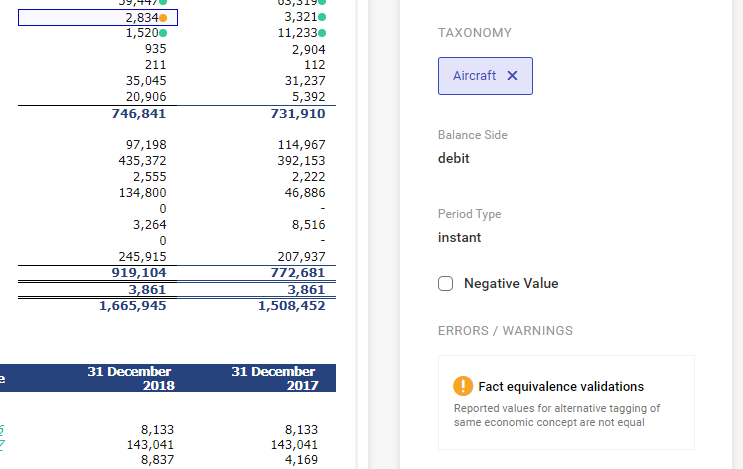
Reporting of negative figures
A company can report negative values in a custom convention. For instance, costs in the profit and loss account are presented with minus sign, in brackets or even in red.
The ESMA recommends that values reported in XBRL tags be consistent with their balance-sheet side (debit/credit) so that they can be machine-processed. Costs, in this case, need to be reported as a positive value. A minus sign is necessary for reporting losses in equity.
However, the XHTML specification allows using the current convention; thus, there is no need to change the reporting layout. It is, however, necessary to indicate those amounts that are reported on a different side than expected. Such amounts are indicated with a dedicated parameter Negative value available in the XBRL tagging section.
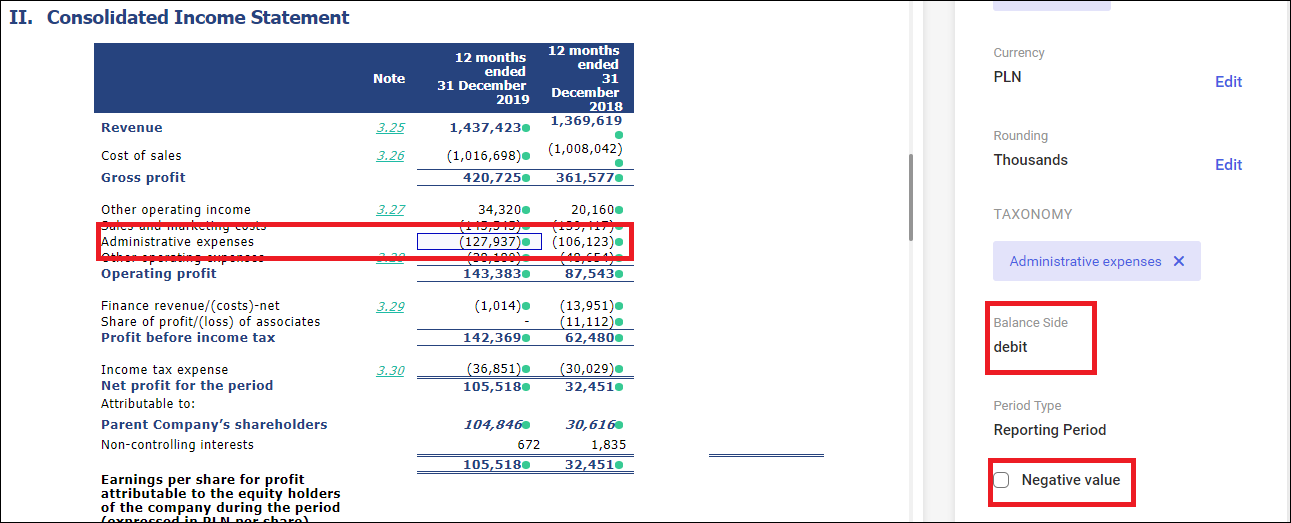
Reporting of costs
As an illustration, a company has adopted a principle that all values reducing the financial result are shown in brackets.
Administrative expenses have been reported in this way. According to the ESMA taxonomy, the Administrative expenses tag reduces the result (it has a debit side). Thus, there is no need to include it in XBRL with minus sign. Therefore, the Negative value parameter should remain deselected.
Reporting of loss
In the analyzed use case, financial transactions reported a loss.
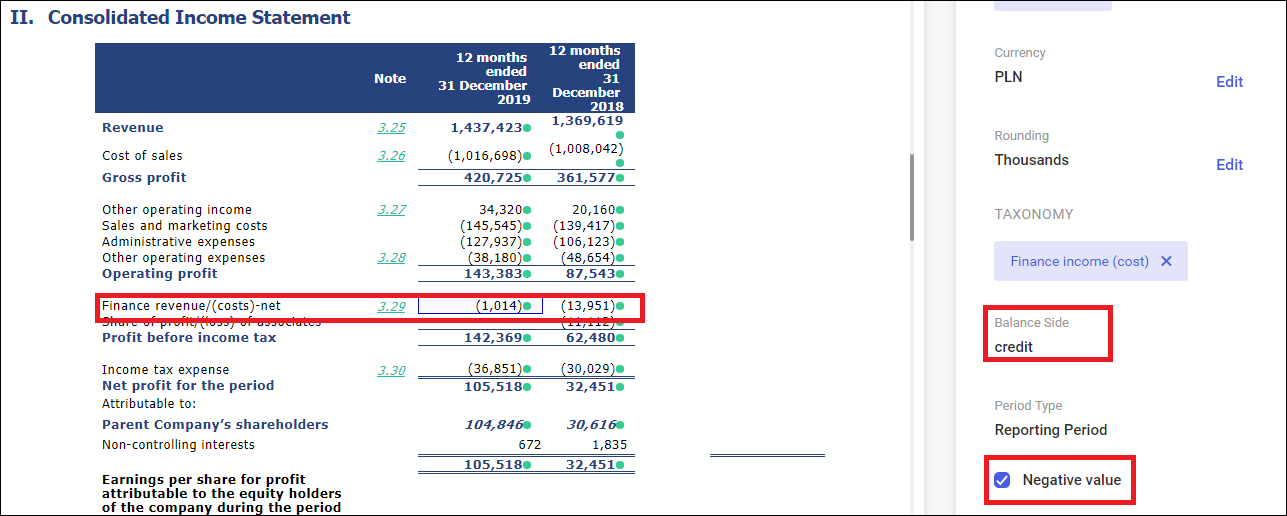
In the case of the Financial revenue (costs) tag, an expected value is revenue (credit side). The loss (debit side) means that it is necessary to use the Negative value parameter. As a consequence, the value with minus sign is added into the XBRL file.
Exporting a reporting package
When exporting a financial statement, it is necessary to export a statement in XHTML format along with its associated taxonomy. A taxonomy is a set of information about the used XBRL tags, including the extensions created by a reporting entity. All this information, that is a report and a taxonomy is called a reporting package.
Taxonomy wizard
A reporting entity should indicate the main statements of which his or her financial statement is composed as part of taxonomy description. In Comarch ESEF, these elements are selected during export. Selecting the Export button opens a wizard where a type of reported statements is specified.
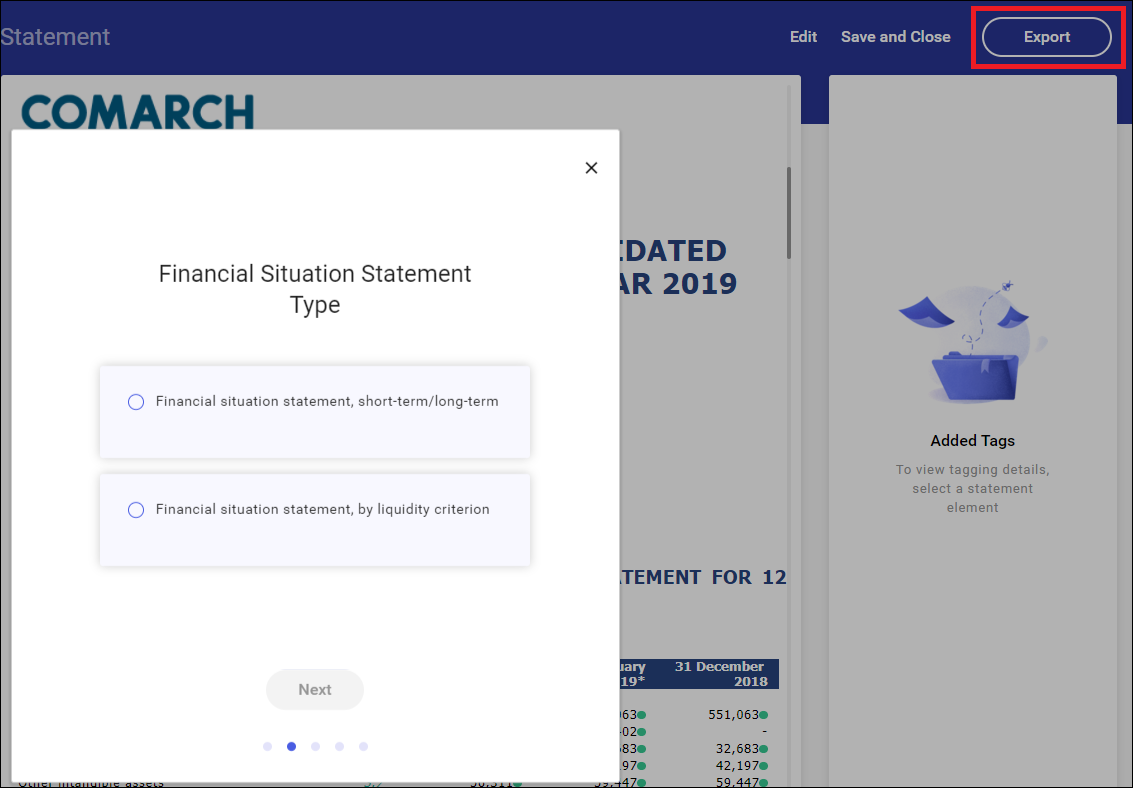
Selectable options are:
- Financial situation statement
- short-term/long-term or
- by liquidity criterion
- Total income statement, profit or loss according to
- the function of expenses or
- the nature of expenses
- Cash flow statement
- direct method or
- indirect method
- Optional statements
- Total income statement (additional statement to the profit and loss account)
- Statement of changes in net assets available for benefits
Based on the selected option, appropriate presentations and calculations of the reported figures are created.
Package content
A reporting package is created in the form of a ZIP file. It contains the main folder compatible with the company’s LEI code and the balance-sheet date of the report, e.g. 2594001MNJ3BH1UVVG70-2019-12-31.
The folder contains the following sub folders:
- META-INF – provides the general information about a taxonomy
- Reports – contains appropriate report files in the form of a regular XHTML page as well as in the form an XHTML page allowing for interactive report browsing (viewer file)
- Entity’s website name, e.g. www.comarch.com. The files with the appropriate taxonomy can be found there in the additional sub folders.
Validation
The European Securities and Markets Authority (ESMA) together with the taxonomy provide rules for the validation of data in a financial statement. Tests being carried out can be completed with errors or warnings. In case of a warning, ESMA recommends additional verification of the tags used, however, this is not a reason to consider the statement as incorrect. Perhaps most data will contain warnings, e.g. due to lack of additional disclosed information necessary for certain group of companies, but not referring to the reporting entity.
Data validation
The data are validated automatically while attempting to export the statement to the hard drive, that is upon selecting the Export button and specifying the elements of the created statement.
If any errors are found in the statement, they will be displayed on the screen.
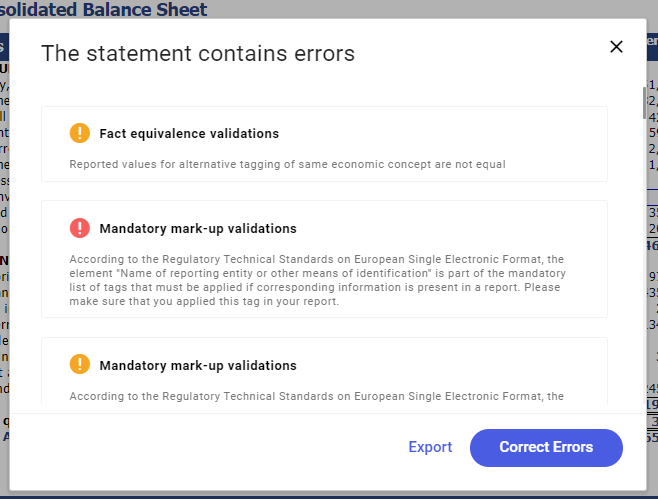
The red color indicates errors and the orange color indicates warnings.
If presented warnings are acceptable, the statement must be exported to hard drive by selecting the Export button.
Error preview
In order to view errors and correct XBRL tags, you can use the default option Correct Errors. You will then be redirected to the tagging screen, where the erroneous tags will be marked with red or orange dot symbol, respectively. Selecting such a tag will present its details together with the error message.